
Back to the lecture notes: Experimental probability: relative frequency and expected frequency 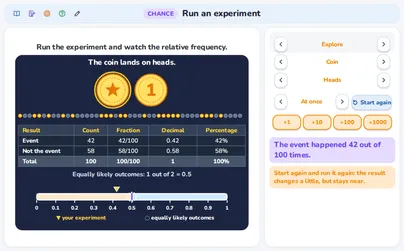
Run an experiment Free
This application is free with a free account
Make a free student account to open this application. It takes a minute, and it also opens 140+ other applications.
Already have an account? Log in and this application opens.
Are you a teacher? Teacher login
What this application teaches
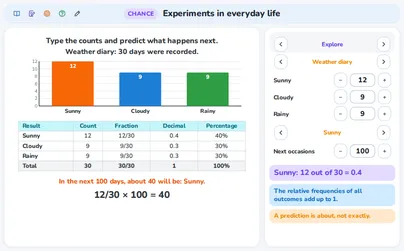
- I can do a chance experiment many times with a coin, a die, a spinner, a bag with replacement or my own chance, and read the frequency table.
- I can write the relative frequency f/n as a fraction, a decimal and a percentage, and I know the relative frequencies of all outcomes add up to 1 (100%).
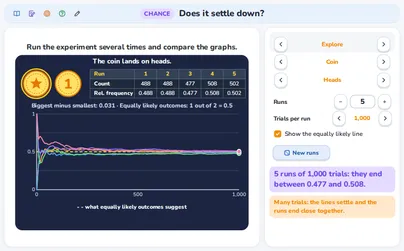
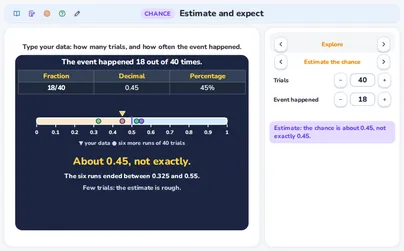
- I know two runs of the same experiment differ, most of all with few trials, and I can expect about how often the event happens: chance × trials, near it but not exactly.
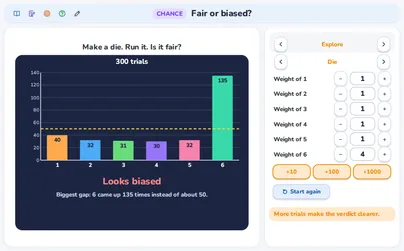
- I can simulate a situation with one event by an own chance in per cent (a drawing pin, a bottle cap, 30% chance of rain), and I know only an experiment can tell when outcomes are not equally likely.
- I can compare my experiment with what equally likely outcomes suggest, “k out of n”.
Fits these school years
IB (MYP, Diploma): MYP 1, MYP 2, MYP 3, MYP 4, MYP 5
Cambridge International: Lower Secondary, stage 7, Lower Secondary, stage 8, Lower Secondary, stage 9
Netherlands: Groep 8, Year 1, Year 2, Year 3 (havo, vwo), Vmbo bb (years 3-4), Vmbo kb (years 3-4), Vmbo gt (years 3-4), Vwo · Mathematics D, Groep 7
Türkiye (MEB): Year 6 (MEB), Year 7 (MEB), Year 8 (MEB)
England (GCSE, A Level): Year 7, Year 8, Year 9
USA (Common Core): Grade 6, Grade 7, Grade 8
Similar applications
Read the lecture notes: Experimental probability: relative frequency and expected frequency