
Back to the lecture notes: Two variables: scatter plots, correlation and regression 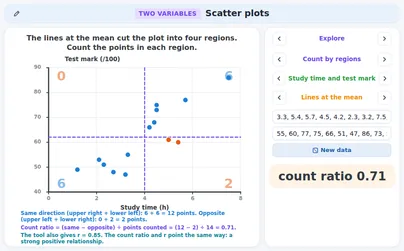
Scatter plots Free
This application is free with a free account
Make a free student account to open this application. It takes a minute, and it also opens 140+ other applications.
Already have an account? Log in and this application opens.
Are you a teacher? Teacher login
What this application teaches
- I can turn a situation into a research question about two quantitative variables, name the explanatory and the response variable and plan a fair collection of pairs (MEB 11.1.1 a–ç).
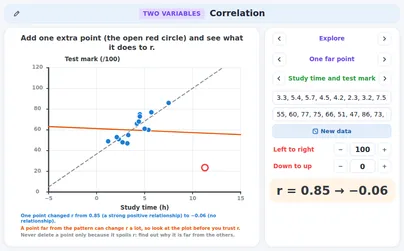
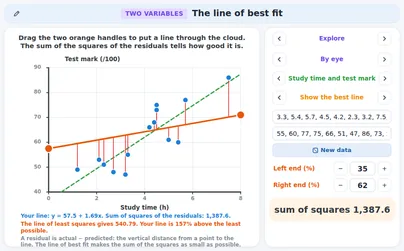
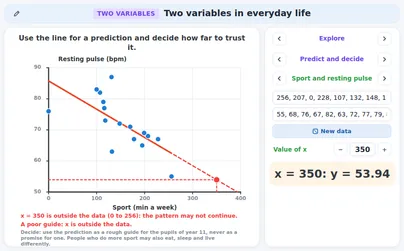
- I can put my own pairs in a scatter plot and read the direction and the strength; the tool gives r (MEB 11.1.1 d, e).
- I can cut a scatter plot into four regions at the means, count the dots, work out the count ratio and compare it with r (MEB 11.1.1 d, e).
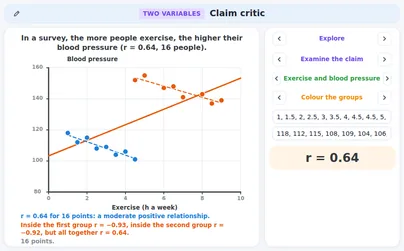
- I can describe the picture in a careful sentence with “in this sample” and without a cause (MEB 11.1.1 f, g).
Fits these school years
IB (MYP, Diploma): MYP 5, Diploma, year 1
Cambridge International: IGCSE
Netherlands: Havo · Mathematics A, Vwo · Mathematics A, Vwo · Mathematics C, Vwo · Mathematics D
Türkiye (MEB): Year 11 (MEB)
England (GCSE, A Level): Year 10 (GCSE), Year 11 (GCSE), Year 12 (A Level)
USA (Common Core): Algebra 1
Similar applications
Read the lecture notes: Two variables: scatter plots, correlation and regression