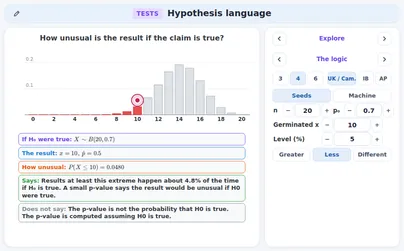
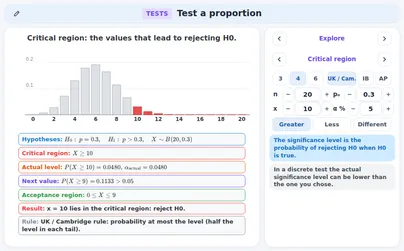
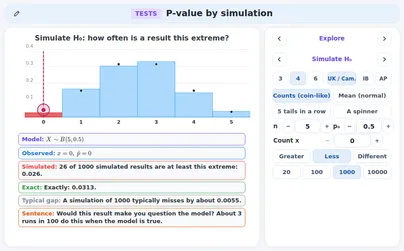
O1[Understand and apply the language of statistical hypothesis testing, developed through a binomial model: null hypothesis, alternative hypothesis, significance level, test statistic, 1-tail test, 2-tail test, critical value, critical region, acceptance region, p-value]; extend to correlation coefficients as measures of how close data points lie to a straight line and be able to interpret a given correlation coefficient using a given p-value or critical value (calculation of correlation coefficients is excluded)Fully covered
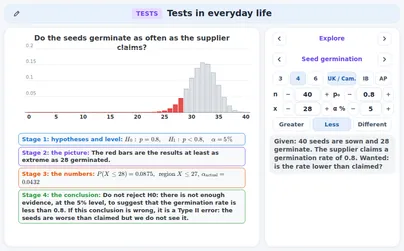
O2AS[Conduct a statistical hypothesis test for the proportion in the binomial distribution and interpret the results in context] [Understand that a sample is being used to make an inference about the population and appreciate that the significance level is the probability of incorrectly rejecting the null hypothesis]Fully covered
Part
a[Conduct a statistical hypothesis test for the proportion in the binomial distribution and interpret the results in context]
b[Understand that a sample is being used to make an inference about the population and appreciate that the significance level is the probability of incorrectly rejecting the null hypothesis]
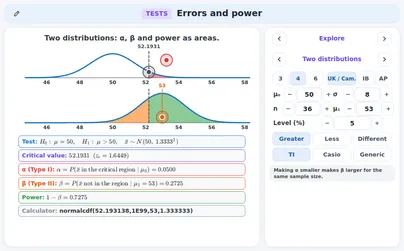
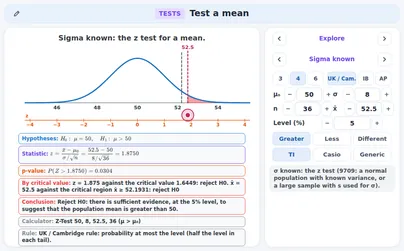
O3AConduct a statistical hypothesis test for the mean of a Normal distribution with known, given or assumed variance and interpret the results in contextFully covered