İnteraktif Dersler

Graphs of sin, cos and tan

Lecture notes

Definition

The graphs of sin and cos

Both are waves between −1 and 1 that repeat every 360°. sin starts at 0 going up, cos starts at its top, 1.
90°180°270°360°−11xysincos
Example
Highest and lowest point of sin:of cos:
360°−11xysincos90270180
Definition

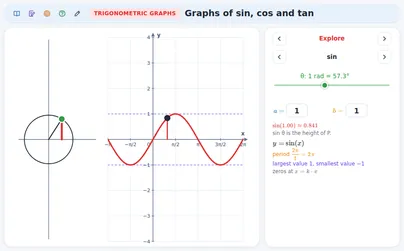
From the unit circle

sin θ is the height of P on the unit circle and cos θ is its x-coordinate. Turn P round and plot the height (or x) against θ: that is the graph. A wheel (radius a, centre height d, speed b) drawsthe amplitude is a, the middle line is d, the period is 360° ÷ b; the start angle shifts the wave.
θsinθP90°180°270°360°−11θy
Example
θ = 30°:The sin graph passes through
90°180°270°360°−11xysin300.5
Rule

cos is sin moved

The cos graph is the sin graph moved 90° to the left.
−90°90°180°270°360°−11xysincos90°
Example
−90°90°180°270°360°−11xysincos
Definition

The graph of tan

It repeats every 180°, has no largest or smallest value and has an asymptote where cos x = 0 (90°, 270°, …).
90°180°270°360°−4−224xytan
Example
At 90°, , so does not exist.
90°180°270°360°−4−224xytan451
Definition

Amplitude, period, middle line

In the amplitude is , the period is and the middle line is .
90°180°270°360°−224xya360°/by=d
Example
the amplitude is the period is the middle line is
90°180°270°360°−224xy3180°y=1
Rule

Highest and lowest value

The wave goes from d − |a| to d + |a|: the middle line minus and plus the amplitude.
90°180°270°360°−224xyd+|a|d−|a|
Example
largest , smallest
90°180°270°360°−224xy4−2
Rule

Other periods

In radians sin(bx) has period 2π ÷ b. tan(bx) has period 180° ÷ b (π ÷ b).
π/2π3π/22π−11xy2π/b2π
Example
120°240°360°−112xy120°180°360°−224xy90°
Rule

Moving and mirroring a wave

In the number c moves the wave to the right, d moves it up. A negative a mirrors it in the x-axis.
180°360°−11xyc180°360°−112xyd180°360°−11xya<0
Example
starts 90° later:the wave starts at with the value .The mirror image turns into .
180°360°−11xy90°180°360°−11xy
Tip

Reading a drawn wave

Read the highest value H and the lowest value L. The period is the distance from one top to the next.
90°180°270°360°−2246xyHLdaT
Example
90°180°270°360°−2246xy5−123180°
Definition

A model: the Ferris wheel

A seat that starts at the bottom has heightr is the amplitude, d the hub height and T the period.
rd102030401020thrTd
Example
r = 10 m, d = 12 m, T = 40 s, t = 20 s: m
101210304010th2022
Watch out!

The usual mistakes

Multiplying by b instead of dividing. Using 360° for the period of tan. Writing a negative amplitude. Mixing up the middle line d and the amplitude a.
180°360°−112xy360°180°360°−224xy180°
Example
✘ has period ✔ period
90°180°270°360°−112xy180°
Tip

Check the answer

Do all values stay between d − |a| and d + |a|? Does the number of waves in 360° match b?number of waves in 360°
90°180°270°360°−224xyd+|a|d−|a|
Example
the values stay between and .
90°180°270°360°−224xy3−1

Exercises

What are the amplitude, the period and the middle line of ? Easy
120°240°360°2xy
Show solution
The amplitude is .
The period is .
The middle line is .
120°240°360°24xy2120°y=1
Answer → amplitude , period , middle line
Check: the values go from to .
Where does have its lowest point from 0° to 360°, and how low is it? Easy
90°180°270°360°−11xy
Show solution
is the x-coordinate of P on the unit circle.
It is smallest when P is at the far left, at 180°.
There .
90°270°360°1xy180−1
Answer → at , the value
Check: cos starts at its top () at and needs half a turn to reach the bottom.
A wave has the highest value 7, the lowest value 1 and the period 180°. It starts on the middle line going up. Write . Medium
90°180°270°360°48xy71180°
Show solution
.
.
The period is , so .
90°180°270°360°48xy71180°
Answer →
Check: at the value is , on the middle line.
What is the period of , and where is its first asymptote after 0°? Medium
Show solution
has period 180°, so has period .
is not defined where its angle is 90°, so .
.
30°60°90°120°−44xy60°
Answer → period , first asymptote at
Check: the next asymptote is 60° further, at .
A Ferris wheel has radius 8 m, its hub is 10 m high and one turn takes 24 s. You get on at the bottom. How high are you after 6 s? Hard
810
Show solution
Use with , , .
, a quarter turn.
90°810
.
Answer → m
Check: after a quarter turn you are level with the hub.
The depth in a harbour is metres (t in hours, degrees). Find the time between two high tides, the largest depth and when it first happens. Hard
Show solution
The period is hours.
6121824246td12
The largest depth is m.
when , so hours.
612182424td35.5
Answer → hours, m, after hours
Check: the smallest depth is m, half a period (6 hours) later, at 9 hours.
Are you a teacher?

Start live lessons with these applications for your whole class. Free to try for one month.

Try it free

Fits these school years

IB (MYP, Diploma): MYP 5, Diploma, year 1

Cambridge International: IGCSE, AS Level

Netherlands: Year 3 (havo, vwo), Vmbo kb (years 3-4), Vmbo gt (years 3-4), Havo · Mathematics B, Vwo · Mathematics A, Vwo · Mathematics B, Vwo · Mathematics C, Havo · Mathematics A

Türkiye (MEB): Year 11 (MEB)

England (GCSE, A Level): Year 11 (GCSE), Year 12 (A Level)

USA (Common Core): Algebra 2, Precalculus

What the applications of this topic teach 6 applications

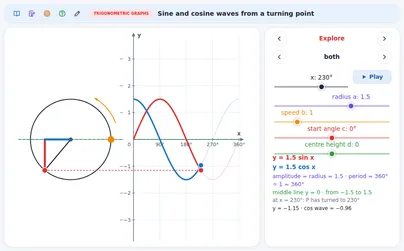
Sine and cosine waves from a turning point
  • Seeing how a turning point draws the sine and cosine waves
  • Reading amplitude, period and middle line from the wheel
  • Setting the wheel so it draws a given wave

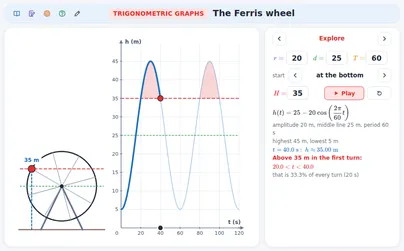
The Ferris wheel: a sinusoid from a ride
  • Seeing the height of a seat on a Ferris wheel as a sine wave in time
  • Finding highest and lowest point, period and height after t seconds
  • Setting the wheel so a ride matches given facts

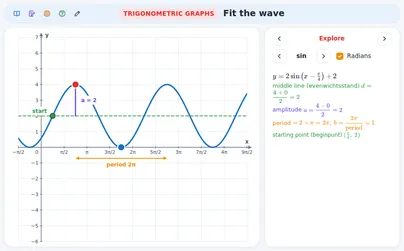
Fit the wave: amplitude, period, shift

  • Finding the amplitude, period, middle line and shift of a wave
  • Saying what each change in y = sin x does to the wave
  • Writing y = a sin(b(x − c)) + d for a drawn wave

Graphs of sin, cos and tan from the unit circle
  • Seeing how the graphs of sin, cos and tan come from the unit circle
  • Reading zeros, highest point, period and asymptotes of the three graphs
  • Finding the period and largest value of y = a sin bx and a tan bx

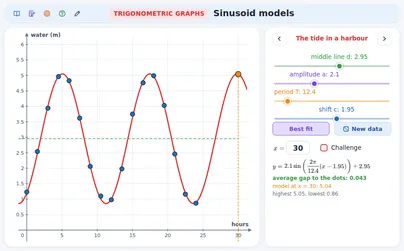
Sinusoid models: tides, daylight, temperature
  • Fitting a sine curve to real data by hand
  • Saying what d, a, T and c mean in a real situation
  • Using the model to read a value for any x

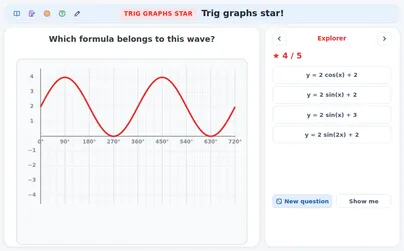
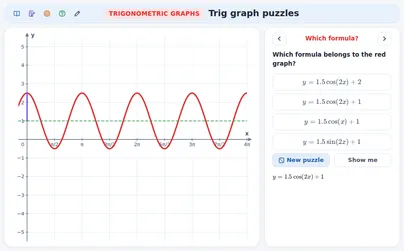
Trig graph puzzles

  • Reading amplitude, period and middle line from a drawn wave
  • Finding the largest value and period from y = a sin(bx) + d
  • Picking the formula that belongs to a graph