İnteraktif Dersler

Linear functions

Lecture notes

Definition

Linear function

A linear function has the formula y = ax + b. Its graph is a straight line. Put in x, multiply by a, add b.
xy
Example
and :
4×312+214
Definition

Slope a

The slope a says how much y changes when x goes up by 1. a > 0: the line rises, a < 0: it falls, a = 0: it is flat. In a situation the slope is the rate of change.
xya>0xya<0xya=0
Example
: gives 5, gives 3.
xy1−253
Definition

y-intercept b

The y-intercept b is the value of y at x = 0: the point where the line cuts the y-axis. In a situation it is the start value.
xyb
Example
at :
xy(0,−5)
Rule

Slope from two points

a = the difference in y ÷ the difference in x, taken in the same order. Then b = y − a·x with one of the points.
xyΔxΔy
Example
Through and :
xy48(2,1)(6,9)−3
Rule

Between and beyond: the line through two measurements

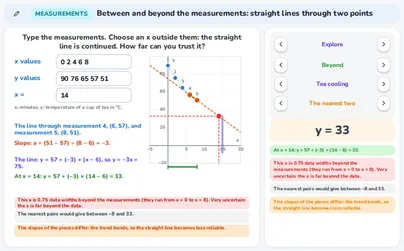
Two neighbouring measurements (x1, y1) and (x2, y2) give a straight line: slope a = (y2 - y1) / (x2 - x1), then y = y1 + a(x - x1). An x between the two measurements is interpolation: a fair estimate. An x outside them is extrapolation: the further outside, the less you can trust the straight line. The application has three tabs: Between (interpolation), Beyond (extrapolation, with a reliability grade) and Reality check (compares the straight line with a typed rule).
2468105101520xy(2,5)(6,13)(10,21)
Example
(2, 5) and (6, 13): slope a = (13 - 5) / (6 - 2) = 2. At x = 4 (between them): y = 5 + 2 x (4 - 2) = 9. At x = 10 (beyond them): y = 5 + 2 x (10 - 2) = 21 — extrapolation, so use with care.
Rule

The zero

The zero is the x where the line meets the x-axis (y = 0). Solve ax + b = 0.
xyx
Example
, so :
6−8−44xy3
Rule

Equal steps in a table

A table is linear when Δy ÷ Δx is the same between every two columns, also when the x-steps are uneven. That number is the slope a.
x013y2511+1+3+2+6
Example
x: 0, 1, 3 and y: 2, 5, 11:
12344812xy36
Tip

Linear, quadratic or exponential?

Equal steps in y: linear. Equal second differences (the steps of the steps): quadratic. The same factor between the y-values: exponential.
xy+dxyΔ²xy×r
Example
y: 1, 4, 9, 16 has steps 3, 5, 7:
14916y357Δ22Δ²
Rule

Parallel and perpendicular

Parallel lines have the same slope. Perpendicular lines have slopes that multiply to −1.
xya₁=a₂xya₁a₂=−1
Example
The line has a parallel with slope 2 and a perpendicular with slope −1/2:
xy
Rule

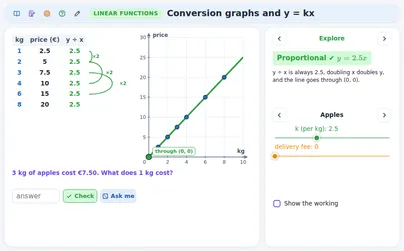
Proportional: y = kx

Proportional means b = 0: the line goes through (0, 0) and y ÷ x = k is the same everywhere. Double x, double y. A conversion graph is of this kind.
xyxy2x2y
Example
3 kg of apples cost €6, so . Then 5 kg cost:
2464812xy5103
Rule

A linear model

cost = start value + rate × number. The start value is the cost for 0, the rate is the cost of each extra one. Use the model both ways: number → cost, and cost → number.
xy1rs
Example
A taxi: €3 to get in and €2 per km. 7 km cost €17. With €25 you ride:
410xy7171125
Rule

Solving with two lines

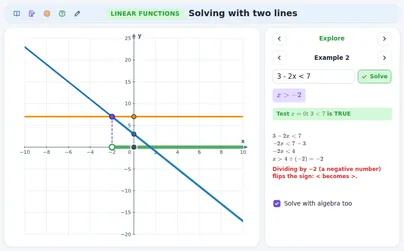
To solve f(x) = g(x), find where the two lines cross. For f(x) < g(x), find where the first line lies below the second. With algebra: set the two formulas equal.
xyfgx
Example
:
246412xyfg37
Rule

Above or below the line

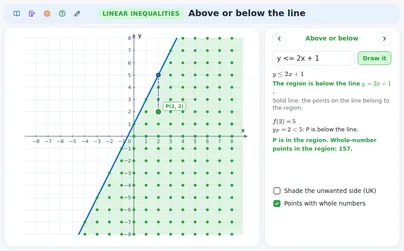
The inequality y > ax + b describes the points above the line. A point (p, q) is above the line when q is more than a·p + b. The line is solid for ≤ and ≥, dashed for < and >.
xy✔
Example
P and the line : and :
123452468xyP
Watch out!

Start value and rate

Do not mix up a and b: the number with x is the rate, the number on its own is the start value.
xy1ab
Example
A gym: €20 to join and €5 per visit, 3 visits:
12452060xy33515✔✘
Watch out!

Dividing by a negative number

Dividing both sides of an inequality by a negative number turns the sign round. The graph shows why.
2−448xy−36
Example
:
−6−4−202x>−3−6−4−202✘x<−3
Special case

Same slope

If the slopes are equal the lines are parallel and never meet (no solution), or they lie on top of each other (every x is a solution).
xy✘xy∞
Example
gives : never true. gives : always true.
xy✘xy∞

Exercises

For give the slope, the y-intercept and the zero. Easy
Show solution
The slope is the number with x: .
xy14
The y-intercept is the number on its own: .
The zero: , so .
−1134−8−44xy2
Answer → , , zero
Check: .
The table has , 2, 3, 4 and , 10, 13, 16. Is it linear? If so, give the formula. Easy
x1234y7101316+1+3+1+3+1+3
Show solution
The steps in y: , , . Equal, and x goes up by 1 each time: linear with .
·.
123455101520xy4
Answer → linear,
Check: .
A line goes through and . Find its formula and the slope of a line perpendicular to it. Medium
2465101520xy(2,7)(5,16)
Show solution
.
, so .
2465101520xy391
Perpendicular: /3.
Answer → and slope −1/3
Check: and .
A gym costs €15 to join and €4 per visit. What do 9 visits cost? How many visits can you pay with €59? Medium
Show solution
The model: cost = × visits.
9 visits: .
€59: take off the start value, then divide by the rate: .
530xy9511159
Answer → €51, and 11 visits
Check: .
Plan A costs €6 and €2 per GB. Plan B costs €18 and €1 per GB. For how many GB do they cost the same, and what is that price? Which plan is cheaper above that? Hard
Show solution
Set them equal: .
, so GB.
The price: .
B has the smaller slope (), so above 12 GB plan B is cheaper.
48162010204050xyAB1230
Answer → at 12 GB, both €30; above that plan B
Check: .
Solve . Then say whether the point P lies above or below the line . Hard
Show solution
.
Divide by −3 and turn the sign: .
For P: .
The y of P is 0, and , so P lies below the line.
xy−2P
Answer → , and P lies below the line
Check: gives .
Are you a teacher?

Start live lessons with these applications for your whole class. Free to try for one month.

Try it free

Fits these school years

IB (MYP, Diploma): MYP 4, Diploma, year 1, MYP 1, MYP 2, MYP 3, MYP 5

Cambridge International: Lower Secondary, stage 8, Lower Secondary, stage 9, IGCSE, Primary, stage 6, Lower Secondary, stage 7, AS Level

Netherlands: Year 2, Year 3 (havo, vwo), Vmbo kb (years 3-4), Vmbo gt (years 3-4), Havo · Mathematics A, Havo · Mathematics B, Vwo · Mathematics A, Vwo · Mathematics B, Vwo · Mathematics C, Year 1, Vmbo bb (years 3-4), Groep 7, Groep 8

Türkiye (MEB): Year 8 (MEB), Year 9 (MEB), Year 7 (MEB), Year 10 (MEB)

England (GCSE, A Level): Year 8, Year 9, Year 10 (GCSE), Year 11 (GCSE), Year 6, Year 7, Year 12 (A Level)

USA (Common Core): Grade 8, Algebra 1, Grade 7, Grade 6, Geometry

What the applications of this topic teach 9 applications

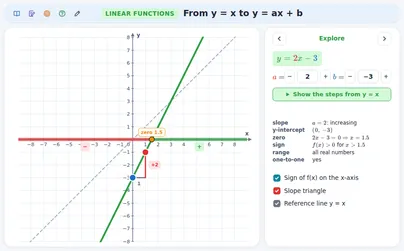
From y = x to y = ax + b

  • Seeing what multiplying by a and adding b does to the line y = x
  • Reading the slope a and the y-intercept b from a graph
  • Telling from the formula whether a line rises or falls

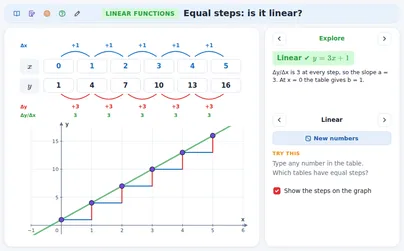
Equal steps: is the table linear?

  • Finding the steps Δx, Δy and Δy/Δx in a table
  • Telling a linear table from a quadratic or exponential one
  • Finding the missing values of a linear table and its a and b

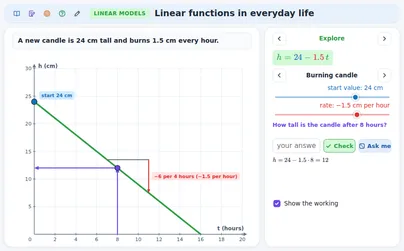
Linear functions in everyday life

  • Writing a real situation as cost = start value + rate × number
  • Saying what the start value and the rate mean, with units
  • Using the model both ways: number to cost and cost to number

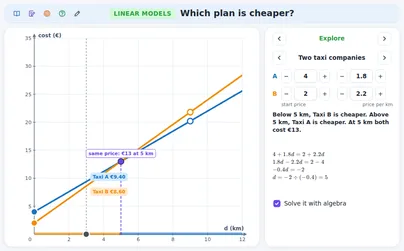
Which plan is cheaper?

  • Comparing two linear plans: start price and price per unit
  • Finding where two plans cost the same
  • Saying which plan is cheaper above and below that point

Solving equations and inequalities with lines
  • Solving an equation or inequality by where two lines meet
  • Solving linear equations and inequalities with algebra
  • Writing an equation or inequality with a given solution

Conversion graphs and y = kx

  • Telling from a table, graph and formula if y is proportional to x
  • Finding k in y = kx and converting both ways
  • Reading a conversion graph forward and back

Above or below the line

  • Saying which side of a line a linear inequality describes
  • Telling if a point lies above, on or below a line
  • Knowing when the line is solid and when dashed

Line puzzles: gems and descriptions

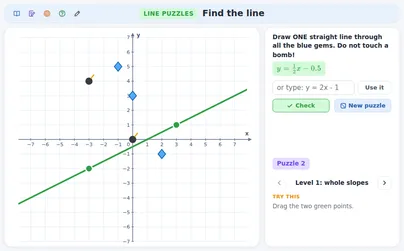
  • Drawing one straight line through given points
  • Making the line that fits a description: slope, points, parallel

Between and beyond the measurements: straight lines through two points
  • Estimate a value between two measurements using the straight line through them.
  • Tell when an estimate is interpolation and when it is extrapolation, and say how reliable it is.
  • Compare a straight-line estimate with a typed rule, inside and beyond the data.