Graphs of real situations
Lecture notes
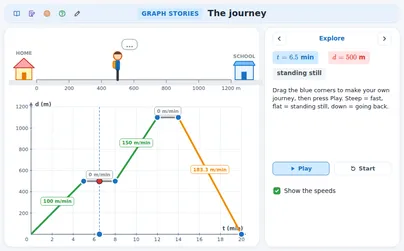
Steepness is speed
Flat is standing still, down is walking back
Average speed
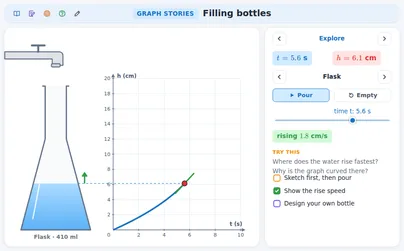
Filling a bottle
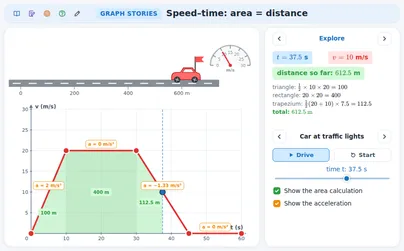
Speed–time graph
Acceleration
Area is distance
A sloping piece is a trapezium
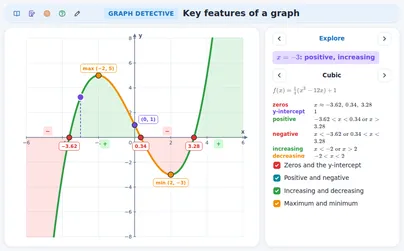
Key features of a graph
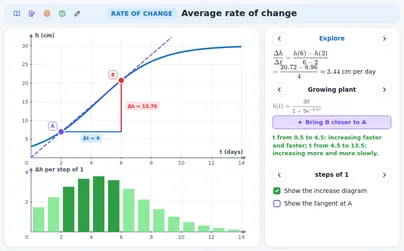
Average rate of change
Faster and faster, or more and more slowly
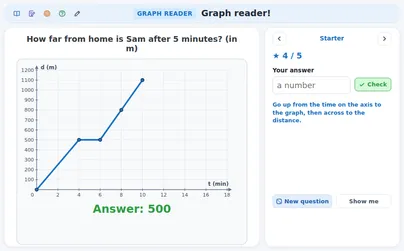
Read corners, give units
A jump in the graph
The graph is not a picture
Mean of the speeds
Exercises
Show solution
Show solution
Show solution
Show solution
Show solution
Show solution
Interactive applications for this topic
Free applications open with a free student account. Teachers can use all applications in a live lesson.
Start live lessons with these applications for your whole class. Free to try for one month.
Try it freeFits these school years
IB (MYP, Diploma): MYP 1, MYP 2, MYP 3, MYP 4, Diploma, year 1
Cambridge International: Lower Secondary, stage 7, Lower Secondary, stage 8, Lower Secondary, stage 9, IGCSE, AS Level
Netherlands: Groep 7, Groep 8, Year 1, Year 2, Vmbo bb (years 3-4), Vmbo kb (years 3-4), Vmbo gt (years 3-4), Havo · Mathematics A, Year 3 (havo, vwo), Vwo · Mathematics C, Havo · Mathematics B, Vwo · Mathematics A, Vwo · Mathematics B
Türkiye (MEB): Year 8 (MEB), Year 9 (MEB), Year 10 (MEB), Year 12 (MEB)
England (GCSE, A Level): Year 7, Year 8, Year 9, Year 10 (GCSE), Year 11 (GCSE), Year 12 (A Level)
USA (Common Core): Grade 6, Grade 8, Algebra 1, Algebra 2
What the applications of this topic teach 7 applications
Filling bottles
- Telling from a bottle's shape where the water rises fast or slowly
- Matching a bottle to its height–time graph
- Shaping a bottle so that its graph is a given graph
The journey: distance-time graphs
- Reading distance and speed of a piece of a distance–time graph
- Knowing that flat means standing still
- Working out the average speed of a journey with a stop
Speed-time graphs: area is distance
- Reading the speed at any moment from a speed–time graph
- Knowing that the steepness of a piece is the acceleration
- Finding the distance as the area under the graph
Graph detective: key features
- Finding the zeros, the sign and the highest and lowest points
- Saying where a graph is increasing or decreasing
- Describing a graph of a real situation with these features
Average rate of change
- Working out the average rate of change between two points
- Giving the unit of a rate: cm per day, euro per year
- Telling if a graph grows faster, slower or steadily
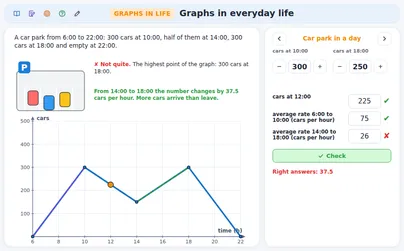
Graphs in everyday life
- Reading graphs of everyday situations: a bike ride, a bath, a lift
- Working out a speed or rate from the graph
- Telling the shape of a graph from the story
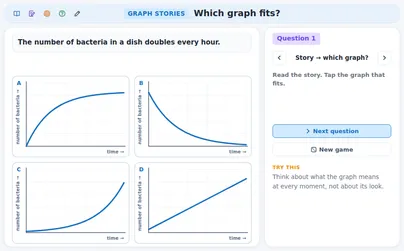
Which graph fits? (puzzles)
- Matching a story to its graph and a graph to its story
- Spotting classic mistakes: the graph as a picture of the road
- Explaining why a wrong graph does not fit