
Histograms Plus
This application is part of Plus
Plus opens all applications: € 4,99 per month or € 19,90 per year. Log in to your account; no account yet? Make a free one first, then you can look at Plus.
Are you a teacher? Teacher login
Your own teacher subscription already includes every application, Plus included — there is nothing extra to buy.
What this application teaches
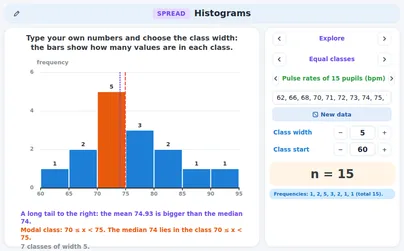
- I can make a histogram of my own data with a class width and a starting point I choose, and find the modal class and the class of the median (MEB 9.6.1 d).
- I can use classes of different widths: the area of a bar is the frequency and the height is the frequency density, frequency ÷ class width (MEB 9.6.1 d, e).
- I can describe the shape of the data (symmetric, a tail to the right or to the left, two peaks) and say what that means for the mean and the median (MEB 9.6.1 f).
Fits these school years
IB (MYP, Diploma): MYP 4, MYP 5, Diploma, year 1, Diploma, year 2
Cambridge International: IGCSE, AS Level, A Level
Netherlands: Year 3 (havo, vwo), Havo · Mathematics A, Vwo · Mathematics A, Vwo · Mathematics C, Year 2
Türkiye (MEB): Year 9 (MEB), Year 11 (MEB), Year 12 (MEB), Year 10 (MEB)
England (GCSE, A Level): Year 10 (GCSE), Year 11 (GCSE), Year 12 (A Level), Year 13 (A Level)
USA (Common Core): Algebra 1, Algebra 2, Precalculus
Similar applications
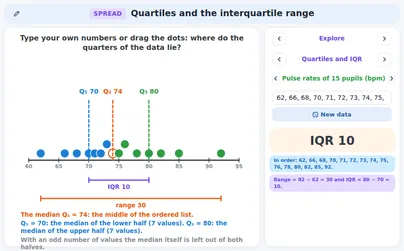
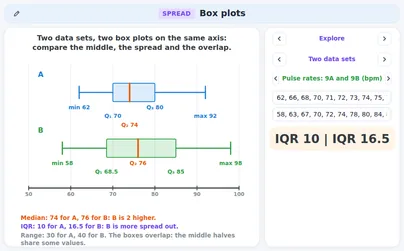
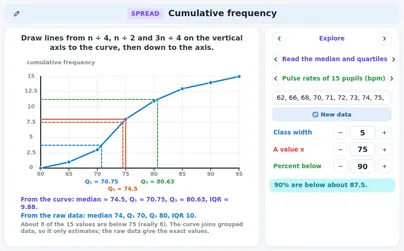
Read the lecture notes: Spread and shape: quartiles, box plots, histograms, standard deviation