İnteraktif Dersler
Lecture notes Exercises

Spread and shape: quartiles, box plots, histograms, standard deviation

Lecture notes

Definition

Quartiles and the IQR

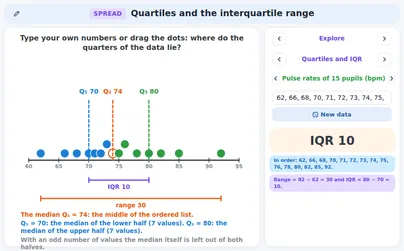
Put the data in order. The median cuts it into two halves: Q₁ is the median of the lower half and Q₃ the median of the upper half. With an odd number of values the middle one is left out of both halves. The IQR holds the middle half of the values (MEB 9.6.1 d).
05101520Q1medQ3
Example
2, 3, 5, 6, 7, 9, 10, 12, 13, 20 so
Definition

Box plot

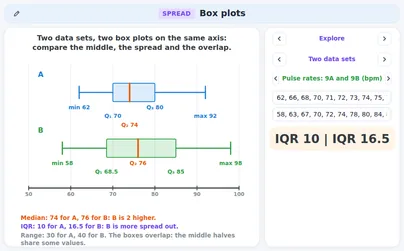
A box plot shows five numbers: the smallest value, Q₁, the median, Q₃ and the largest value. The box runs from Q₁ to Q₃ with a line at the median, and the whiskers reach to the smallest and the largest value. Each of the four parts holds about a quarter of the values (MEB 9.6.1 d, e).
0510152018
Example
Five numbers 2, 5, 8, 12 and 20box from 5 to 12, line at 8, whiskers to 2 and 20
Rule

Histogram

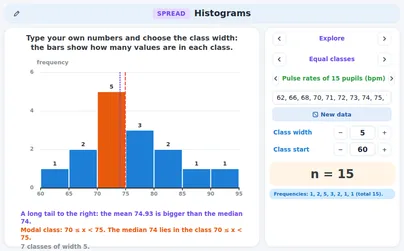
A histogram has bars that touch, one for each class. The height is the number of values in the class, so the tallest bar is the modal class. With classes of different widths the area of a bar is the frequency and the height is the frequency density (MEB 9.6.1 d, f).
02468010203040
Example
Classes of width 10 with 2, 5, 8 and 3 values values, the tallest bar is 20 to 30
Rule

Cumulative frequency

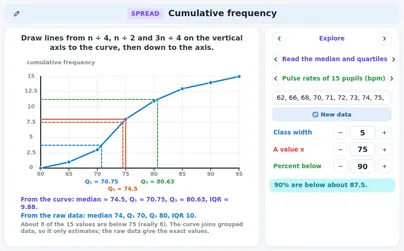
The cumulative frequency is a running total: add the classes one by one. Plot each total above the upper border of its class and join the points. The last total is n. Read the median at height n ÷ 2, Q₁ at n ÷ 4 and Q₃ at 3n ÷ 4 (MEB 9.6.1 d, e).
Example
Frequencies 2, 5, 8 and 3 give the running totals and the median is at , in the class 20 to 30
Rule

Standard deviation

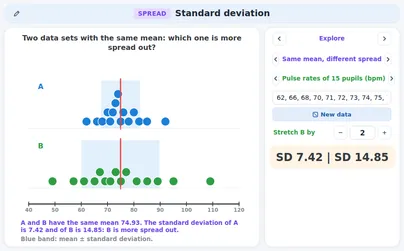
The standard deviation tells the typical distance of the values from the mean. Find the mean, square every distance to the mean, take the mean of these squares and then the square root. Divide by n for a whole group and by n − 1 for a sample (MEB 9.6.1 d, e).
0246810
Example
2, 4, 4, 4, 5, 5, 7, 9 has mean 5 and the squared distances add up to 32
Definition

How big is the difference between two groups?

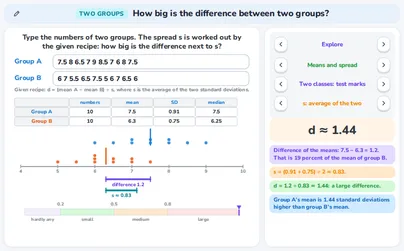
The spread of one group (Q1, Q3, the standard deviation) also tells you how big a difference between two groups really is. Two measures: (1) compare the two box plots — where does the median of one group lie against the other group's box, and how much do the boxes overlap; (2) the effect size d = (mean A − mean B) ÷ s divides the difference of the means by a spread s (a *given* recipe states which one: here “the average of the two standard deviations”). A rule of thumb for d: under 0.2 hardly any difference, 0.2 to 0.5 small, 0.5 to 0.8 medium, 0.8 or more large. In “How big is the difference between two groups?” the tab Box plots draws both boxes and the tab Means and spread works out d.
Group AGroup B510152025Finishing time (minutes)Finishing times of two groups
Example
Finishing times (minutes) of a race: group A (5 runners) 12, 15, 18, 20, 24; group B (6 runners) 9, 11, 13, 15, 17, 19. Five numbers: A is 12, 13.5, 18, 22, 24; B is 9, 11, 14, 17, 19. Median A (18) lies above Q3 of B (17): outside B's box. Median B (14) lies inside A's box (13.5 to 22). One out, one in: a possible difference. The boxes overlap by 58% of the shorter box (IQR B = 6); the medians are 0.55 IQRs apart. Mean A = 17.8, mean B = 14, difference 3.8. s is the average of 4.6 and 3.74, s = 4.17; d = 3.8 ÷ 4.17 ≈ 0.91. That is 0.8 or more, so a large difference — group A is clearly slower.
Rule

By hand: standard deviation, covariance and the geometric mean

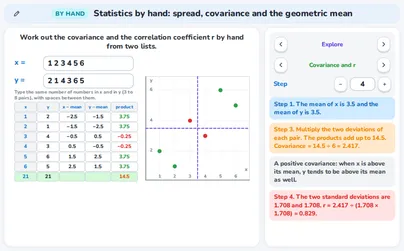
To find the standard deviation by hand: take the mean, subtract it from every number, square the deviations, add them, divide by n (a whole group) or by n − 1 (a sample) and take the square root. The covariance multiplies the two deviations of every pair, adds the products and divides by n; its sign tells whether x and y tend to be above their means together. The geometric mean takes a root of the product: it fits growth factors. In Standard deviation, Covariance and r and Geometric mean of "Statistics by hand: spread, covariance and the geometric mean" every column is written out.
Example
For 2 4 4 4 5 5 7 9 the mean is 5; the squared deviations 9 + 1 + 1 + 1 + 0 + 0 + 4 + 16 add up to 32; dividing by n = 8 gives the variance 4 and the standard deviation 2. For x = 1 2 3 4 5 and y = 2 3 5 4 6 the products of the deviations are 4, 1, 0, 0, 4, so the covariance is 9 ÷ 5 = 1.8 and r = 9 ÷ 10 = 0.9. The geometric mean of 2 and 8 is the square root of 16, which is 4; the arithmetic mean is 5.
Rule

Outliers

A value outside the two fences is an outlier; a box plot draws it as a separate dot. A far value changes the range a lot but the IQR hardly, and it pulls the mean and the standard deviation (MEB 9.6.1 e, f).
05101520253022.5
Example
2, 3, 5, 6, 7, 9, 10, 12, 13, 30 has and IQR 7 so 30 is an outlier
Rule

Choosing a display and a summary

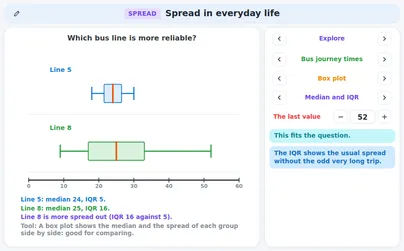
A dot plot or histogram shows the shape. A box plot compares groups and shows far values. A cumulative frequency graph gives the median and quartiles of grouped data. About symmetric and no far values: tell the mean and the standard deviation. Skewed or with a far value: tell the median and the IQR (MEB 9.6.1 d–g).
01020304050
Example
Minutes to school 8, 9, 10, 10, 11, 12 and 45mean , median 10 and IQR : tell the median and the IQR
Watch out!

A long whisker is not many values

Each part of a box plot holds about a quarter of the values, however long it is. A long whisker means the values there are far apart, not that there are more of them. In the same way the tallest bar of a histogram with different class widths need not hold the most values: compare the areas.
Example
In 2, 3, 5, 6, 7, 9, 10, 12, 13, 20 the whisker from 12 to 20 is long and the one from 2 to 5 is shortbut each holds 3 values

Exercises

Find Q₁, the median, Q₃ and the IQR of 2, 4, 5, 7, 8, 10, 11, 13, 14, 16, 19. Easy
05101520
Show solution
There are 11 values and the sixth one is in the middle, so the median is 10
The lower half is 2, 4, 5, 7, 8 so
The upper half is 11, 13, 14, 16, 19 so
Answer → Q₁ = 5, median = 10, Q₃ = 14, IQR = 9
The median is left out of both halves because there are 11 values, an odd number.
A box plot has the smallest value 12, Q₁ = 20, median = 26, Q₃ = 40 and the largest value 60. Find the range and the IQR. What part of the values lies inside the box? Easy
Show solution
The box runs from Q₁ to Q₃, so it holds the middle half of the values
Answer → range 48, IQR 20, half of the values
Every quarter of the values lies between two neighbouring numbers of the five.
A histogram has classes of width 10 starting at 0 with frequencies 4, 9, 12 and 5. How many values are there and which class is the modal class? Easy
04812010203040
Show solution
values
The tallest bar has 12 values, the class
Answer → 30 values; modal class 20 ≤ x < 30
The modal class is the class with the most values: the tallest bar.
A cumulative frequency table gives the running totals 6, 20, 44 and 50 at the borders 10, 20, 30 and 40 (the classes start at 0). Find the frequency of each class and the class that holds the median. Medium
Show solution
The frequencies are the differences of neighbouring totals: , , and
There are 50 values, so the median is at height
The total is 20 at the border 20 and 44 at 30, so the value at height 25 is in the class
Answer → frequencies 6, 14, 24, 6; the median is in 20 ≤ x < 30
The last total is always n, here 50.
Two groups both have mean 5. Group A is 3, 3, 7, 7 and group B is 4, 4, 6, 6. Find both standard deviations (divide by n). Which group is more spread out? Medium
Show solution
In group A every value is 2 away from the mean, so the squares are 4, 4, 4 and 4
In group B every value is 1 away, so
Answer → s_A = 2 and s_B = 1; group A is more spread out
Same mean, different spread: the mean alone cannot tell the groups apart.
In a data set Q₁ = 24 and Q₃ = 36. The smallest value is 8 and the largest is 62. Which values are outliers? Medium
Show solution
and
The lower fence is and the upper fence is
8 is above 6, so it is not an outlier; 62 is above 54, so it is an outlier
Answer → only 62 is an outlier
Check both fences: a value that is far from the box can still be inside.
The quiz scores are 4, 5, 6, 7, 8, 9, 10, 11, 12 and 13. A new score 40 is added. Find the range and the IQR before and after. Is 40 an outlier? Hard
Show solution
Before, and , so and
After, there are 11 values with median 9, and , so and
The upper fence is and 40 is above it
Answer → range 9 to 36, IQR 5 to 6; 40 is an outlier
One far value changes the range a lot and the IQR only a little.
Monthly pay in € in a shop: 1800, 1900, 2000, 2100, 2200 and 9000 (the owner). Find the mean, the median and the IQR. Which centre and spread tell what a worker earns? Hard
Show solution
and
The 9000 pulls the mean far up: tell the median and the IQR
Answer → mean about 3167, median 2050, IQR 300; tell the median and the IQR
The mean is higher than the pay of five of the six people.
A histogram has the classes with 15 values, with 24 values and with 21 values. Find the frequency density of each class. Which bar is the tallest and which class holds the most values? Hard
Show solution
, and
The tallest bar is the first one, but the middle class holds the most values
Answer → densities 1.5, 1.2 and 0.7; tallest bar ; most values in
With classes of different widths compare areas, not heights.
Are you a teacher?

Start live lessons with these applications for your whole class. Free to try for one month.

Try it free

Fits these school years

IB (MYP, Diploma): MYP 4, MYP 5, Diploma, year 1, Diploma, year 2

Cambridge International: IGCSE, AS Level, A Level

Netherlands: Year 3 (havo, vwo), Havo · Mathematics A, Vwo · Mathematics A, Vwo · Mathematics C, Year 2

Türkiye (MEB): Year 9 (MEB), Year 11 (MEB), Year 12 (MEB), Year 10 (MEB)

England (GCSE, A Level): Year 10 (GCSE), Year 11 (GCSE), Year 12 (A Level), Year 13 (A Level)

USA (Common Core): Algebra 1, Algebra 2, Precalculus

What the applications of this topic teach 8 applications

Quartiles and the interquartile range

  • Finding the median and the quartiles Q₁ and Q₃ of a list
  • Working out the range and the interquartile range
  • Finding an outlier with the fences 1.5 × IQR

Box plots

  • Drawing and reading a box plot with its five numbers
  • Saying what a box plot shows: median, range, IQR, quarters
  • Comparing two box plots on one axis

Histograms

  • Making a histogram with a chosen class width and start
  • Using classes of different widths: area is frequency, height is density
  • Describing the shape: symmetric, skewed or two peaks

Cumulative frequency

  • Making a cumulative frequency table and plotting the curve
  • Reading the median and quartiles from the curve
  • Reading how many values lie below a value

Standard deviation

  • Saying what the standard deviation tells about spread
  • Telling which of two sets with the same mean is more spread out
  • Seeing what one far value does to the standard deviation, IQR and range

Statistics by hand: spread, covariance and the geometric mean

  • Working out the standard deviation by hand with a table
  • Working out the covariance and the correlation coefficient r
  • Working out a geometric mean

Spread in everyday life

  • Choosing a display and a summary that fit a real question
  • Reading the result in words: which group is more spread out
  • Judging if a choice fits: a very high pay pulls the mean

How big is the difference between two groups?

  • Type two groups' numbers and work out the difference of their means, the standard deviation of each, and the effect size d with a given recipe for the spread.
  • Compare two box plots: where a median lies against the other box, how much the boxes overlap, and whether the difference is small, possible or clear.
  • Find the largest gap between two cumulative percentages and work out the percentages, their difference, the ratio and phi of a two-by-two table.