Charts: draw, read and judge
Lecture notes
Half symbols
Reading a bar chart
A bar between two lines
Drawing a bar chart
Choosing the scale
Title, labels and units
Bar-line chart and dot plot
Reading a line graph
Reading between two points
Choosing the axis of a line graph from a table
A bad scale: points off the paper, a flat line
Two lines in one graph
Dual bar chart
Stacked bars
Pie chart: fractions and percentages
Pie chart: angle = number ÷ total × 360
Stem-and-leaf diagram
Decimals and back to back
Choosing a chart
Mean or median?
Why a chart does not fit
Misleading axes
Misleading pictures
Judging a claim
Spread: the IQR
Spread: the standard deviation
What comes next
An infographic has parts
A headline: of which group?
Pictures can trick you: a big first icon
Exercises
Show solution
Show solution
Show solution
Show solution
Show solution
Show solution
Show solution
Show solution
Show solution
Interactive applications for this topic
Free applications open with a free student account. Teachers can use all applications in a live lesson.
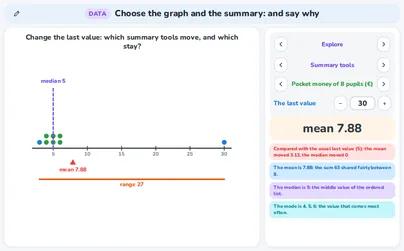
PlusChoose the graph and the summary: and say why
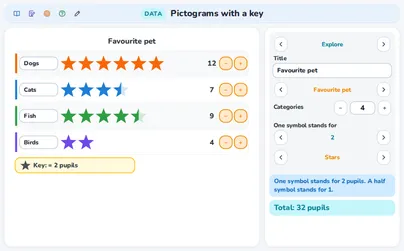
FreePictograms with a key
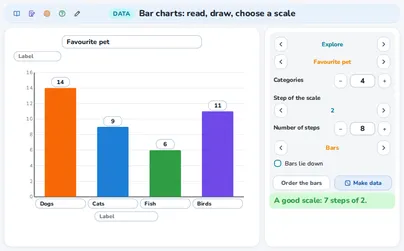
PlusBar charts: read, draw, choose a scale
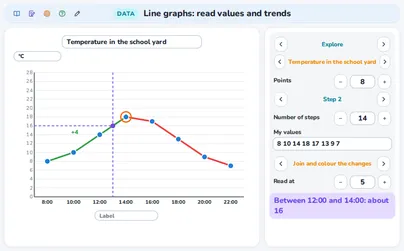
PlusLine graphs: read values and trends
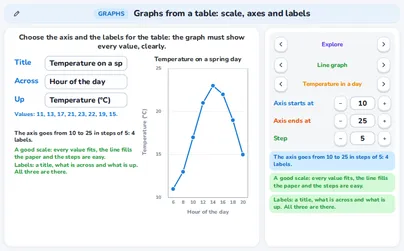
PlusGraphs from a table: scale, axes and labels
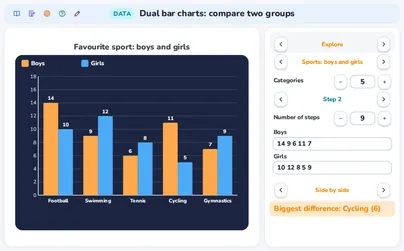
PlusDual bar charts: compare two groups
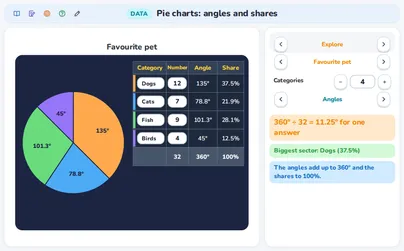
PlusPie charts: angles and shares
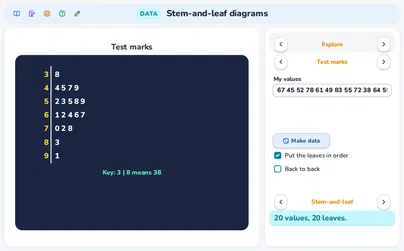
PlusStem-and-leaf diagrams
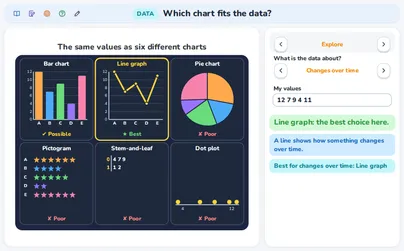
PlusWhich chart fits the data?
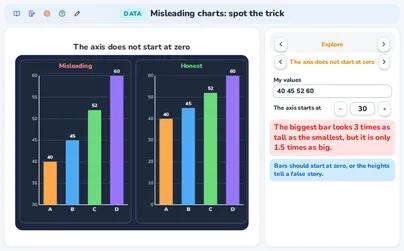
PlusMisleading charts: spot the trick
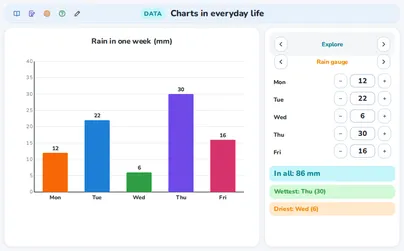
PlusCharts in everyday life
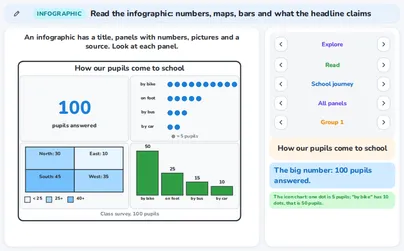
PlusRead the infographic: numbers, maps, bars and the headline
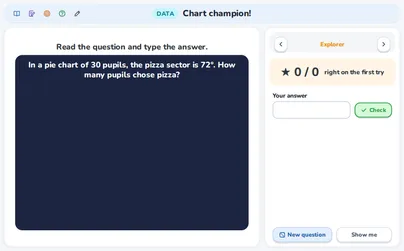
PlusChart champion! (quiz)
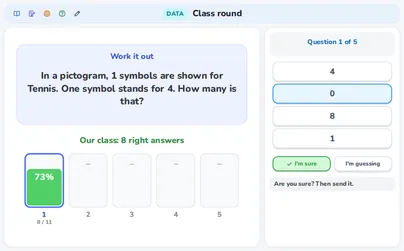
PlusClass round: the whole class at once Start live lessons with these applications for your whole class. Free to try for one month.
Try it freeFits these school years
IB (MYP, Diploma): MYP 1, MYP 2, MYP 3, PYP, MYP 4, MYP 5
Cambridge International: Lower Secondary, stage 7, Lower Secondary, stage 8, Lower Secondary, stage 9, Primary, stage 4, Primary, stage 5, Primary, stage 6
Netherlands: Year 2, Year 3 (havo, vwo), Groep 5, Groep 6, Groep 7, Year 1, Groep 8, Havo · Mathematics A, Vwo · Mathematics A, Vwo · Mathematics C, Vmbo bb (years 3-4), Vmbo kb (years 3-4), Vmbo gt (years 3-4)
Türkiye (MEB): Year 7 (MEB), Year 9 (MEB), Year 3 (MEB), Year 4 (MEB), Year 5 (MEB), Year 6 (MEB), Year 8 (MEB)
England (GCSE, A Level): Year 7, Year 8, Year 9, Year 10 (GCSE), Year 4, Year 5, Year 6
USA (Common Core): Grade 6, Grade 7, Grade 8, Grade 3, Grade 4, Grade 5
What the applications of this topic teach 12 applications
Choose the graph and the summary: and say why
- Saying which summary fits a question: mean, median, mode, range
- Seeing what one very different value does to the mean and median
- Choosing a line graph or a dot plot and giving the reason
Pictograms with a key
- Reading a pictogram: counting symbols and multiplying by the key
- Knowing that a half symbol stands for half the key
- Drawing a pictogram and choosing a key
Bar charts: read, draw, choose a scale
- Reading a bar chart, standing or lying: values, differences, totals
- Drawing bars from zero by dragging their tops
- Choosing a scale with a step of 1, 2, 5 or 10
- Giving a chart a title, axis labels and units
Line graphs: read values and trends
- Reading a line graph: values, highest and lowest points, changes
- Seeing a trend and finding the biggest rise
- Drawing a line graph from a table by dragging points
- Estimating a value between points and predicting the next one
Graphs from a table: scale, axes and labels
- Choosing where the axis starts and ends and an easy step
- Writing a title and saying what is across and up, with units
- Putting two lines on one scale and seeing what a cut axis does
Dual bar charts: compare two groups
- Reading a dual bar chart: comparing two groups per category
- Drawing a dual bar chart from a table
- Reading a stacked bar chart: whole and parts
Pie charts: angles and shares
- Reading a pie chart as fractions and percentages of a whole
- Working out the angle of a sector: number ÷ total × 360
- Going back from an angle to the number and percentage
- Knowing a pie chart fits only the parts of one whole
Stem-and-leaf diagrams
- Building and reading a stem-and-leaf diagram with a key
- Reading a diagram with decimal values
- Reading a back-to-back diagram to compare two groups
- Making a dot plot of whole numbers close together
Which chart fits the data?
- Choosing a chart that fits the data and the question
- Saying why a chart does not fit
- Making a bar chart and a line chart of own numbers
Misleading charts: spot the trick
- Spotting a cut axis and uneven steps
- Spotting a tilted 3D pie and pictures growing in two directions
- Judging a claim made with a chart
- Seeing why two charts rising together do not prove a cause
Charts in everyday life
- Reading a pictogram with a key, such as 10 per symbol
- Reading bars and a line graph in real situations
- Looking at the scale of a chart before reading a value
Read the infographic: numbers, maps, bars and the headline
- Reading the parts of an infographic
- Checking a headline against the numbers: which group is the percent of
- Making an own infographic from four numbers