
Line graphs: read values and trends Plus
This application is part of Plus
Plus opens all applications: € 4,99 per month or € 19,90 per year. Log in to your account; no account yet? Make a free one first, then you can look at Plus.
Are you a teacher? Teacher login
Your own teacher subscription already includes every application, Plus included — there is nothing extra to buy.
What this application teaches
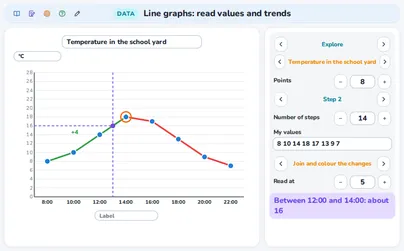
- I can read a line graph: the value at a time, the highest and lowest points and a change between two times.
- I can see a trend (rising, falling or steady) and find the biggest rise between two times.
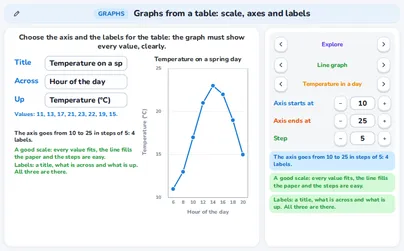
- I can draw a line graph from a table by dragging the points, and give it a title, labels and a scale.
- I can estimate a value between two points, and I know when the points may be joined.
- I can predict the next point of a line graph from the trend: from 2 to 17 in 5 steps is 3 each time, so about 20 comes next, and I know that a prediction is only right if the trend continues.
- I can read two lines in one graph and compare them: Class A goes from 10 to 35 books (a change of 25) and Class B from 20 to 30 (a change of 10), so Class A changed more.
Fits these school years
IB (MYP, Diploma): MYP 1, MYP 2, MYP 3, PYP, MYP 4, MYP 5
Cambridge International: Lower Secondary, stage 7, Lower Secondary, stage 8, Lower Secondary, stage 9, Primary, stage 4, Primary, stage 5, Primary, stage 6
Netherlands: Year 2, Year 3 (havo, vwo), Groep 5, Groep 6, Groep 7, Year 1, Groep 8, Havo · Mathematics A, Vwo · Mathematics A, Vwo · Mathematics C, Vmbo bb (years 3-4), Vmbo kb (years 3-4), Vmbo gt (years 3-4)
Türkiye (MEB): Year 7 (MEB), Year 9 (MEB), Year 3 (MEB), Year 4 (MEB), Year 5 (MEB), Year 6 (MEB), Year 8 (MEB)
England (GCSE, A Level): Year 7, Year 8, Year 9, Year 10 (GCSE), Year 4, Year 5, Year 6
USA (Common Core): Grade 6, Grade 7, Grade 8, Grade 3, Grade 4, Grade 5
Similar applications
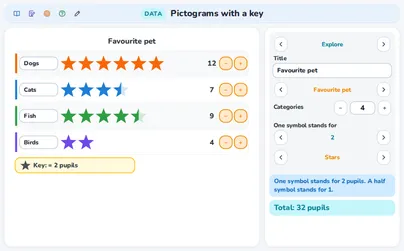 FreePictograms with a key
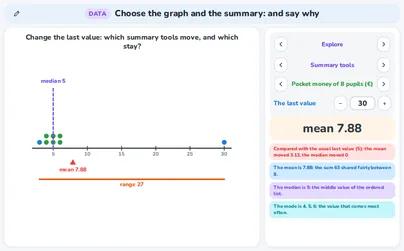 PlusChoose the graph and the summary: and say why
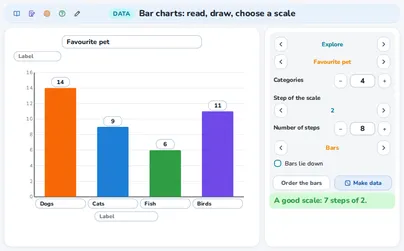 PlusBar charts: read, draw, choose a scale
 PlusGraphs from a table: scale, axes and labels
 PlusDual bar charts: compare two groups
 PlusPie charts: angles and shares
 PlusStem-and-leaf diagrams
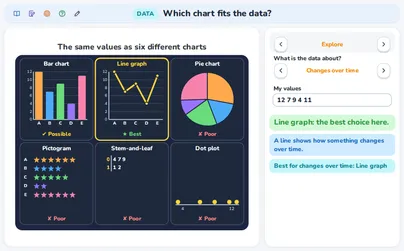 PlusWhich chart fits the data?
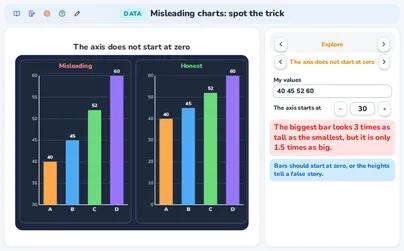 PlusMisleading charts: spot the trick
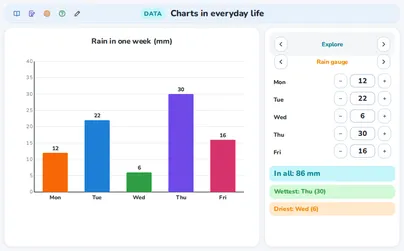 PlusCharts in everyday life
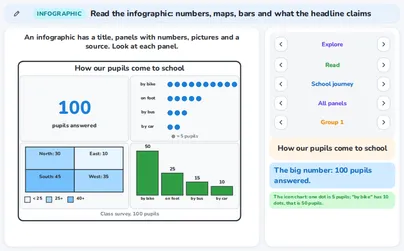 PlusRead the infographic: numbers, maps, bars and the headline