
Quartiles and the interquartile range
This is a demo, open for everybody. A free account opens 140+ applications; Plus opens all of them.
Make a free account Log inWhat this application teaches
- I can find the median, the lower quartile Q₁ and the upper quartile Q₃ of my own list of numbers: the median of each half (MEB 9.6.1 d).
- I can work out the range and the interquartile range IQR = Q₃ − Q₁ and say what each one tells (MEB 9.6.1 d, e).
- I can use the fences Q₁ − 1.5 × IQR and Q₃ + 1.5 × IQR to find an outlier, and I know what a far value does to the range and to the IQR (MEB 9.6.1 e, f).
How to use it
Aim: Type your own numbers or drag the dots and see how the ordered data is cut into quarters. The tool shows Q₁, the median, Q₃, the range and the IQR, marks outliers and compares three ways to find the quartiles.
- In Explore choose Quartiles and IQR. Choose a data set or type your numbers in Data (type numbers): 4 to 30 numbers, apart by spaces, commas or semicolons. You can also drag a dot or press New data.
- Look at the colours: the lower half is blue and the upper half is green. Q₁ is the median of the lower half, Q₃ the median of the upper half. With an odd number of values the median itself is left out of both halves.
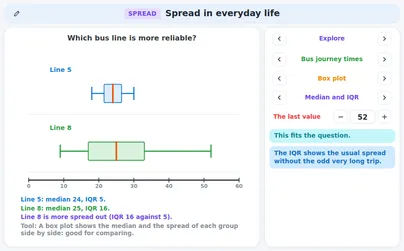
- Read the brackets under the dots. The range is the largest value minus the smallest. The IQR is Q₃ − Q₁ and holds the middle half of the values. Change one value and see which of the two moves.
- Open Outliers. A value outside the fences Q₁ − 1.5 × IQR and Q₃ + 1.5 × IQR is an outlier (red). Choose With the extra value and change Extra value: the range jumps, the IQR hardly moves.
- Open Other methods: three rules for the quartiles can give slightly different numbers. This tool always uses the first one, Halves without the median (used here). A spreadsheet uses its own rule, so its answer can differ a little.
- In Guess first, read the question, choose your answer, then look at the picture and the reason.
- In Practice choose a level (Starter, Explorer or Champion), type or choose your answer and press Check. Stuck? Press Hint; Next step shows the solution one step at a time and Show answer gives the answer. New problem gives another one.
Tip for teachers: Ask “Which is steadier when one pupil has a very odd value, the range or the IQR?” and let the pupils predict before they drag the dot. When a pupil's spreadsheet gives another Q₁, open Other methods instead of saying who is wrong.
Fits these school years
IB (MYP, Diploma): MYP 4, MYP 5, Diploma, year 1, Diploma, year 2
Cambridge International: IGCSE, AS Level, A Level
Netherlands: Year 3 (havo, vwo), Havo · Mathematics A, Vwo · Mathematics A, Vwo · Mathematics C, Year 2
Türkiye (MEB): Year 9 (MEB), Year 11 (MEB), Year 12 (MEB), Year 10 (MEB)
England (GCSE, A Level): Year 10 (GCSE), Year 11 (GCSE), Year 12 (A Level), Year 13 (A Level)
USA (Common Core): Algebra 1, Algebra 2, Precalculus
Similar applications
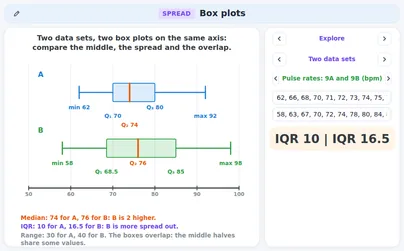
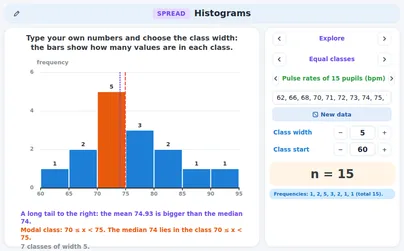
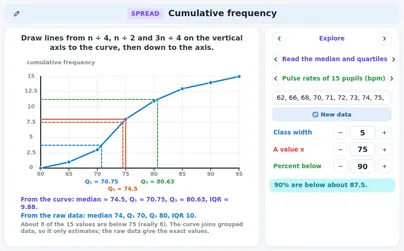
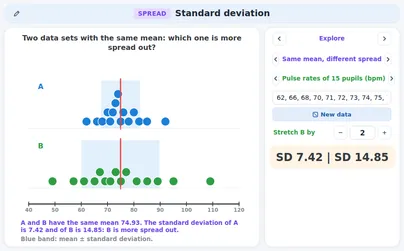
Read the lecture notes: Spread and shape: quartiles, box plots, histograms, standard deviation