3.1aSorting and displaying discrete data
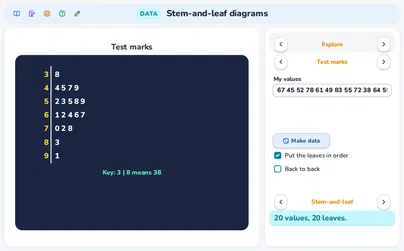
1Pupils sort simple discrete data into groups and categories and show it in a table or a dot plot, then use the display to answer questions about the data.1
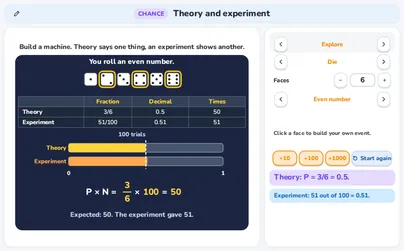
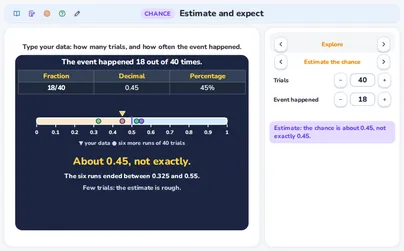 Estimate and expectType the data of an experiment to estimate the chance, or type a chance and the trials to see how often to expect it.Open
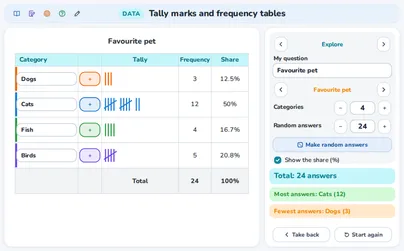 Tally marks and frequency tablesMake your own survey, tally the answers in fives and build the frequency table with its total and shares.Open
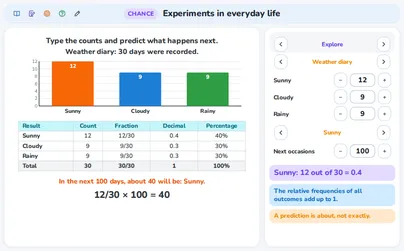 Experiments in everyday lifeChoose a real-life scene, type the counts of three outcomes and predict what happens next.Open
These applications belong to the topic as a whole, not to one outcome.
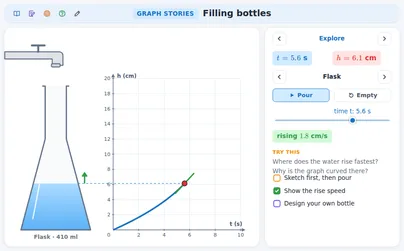 Filling bottlesFilling bottles: a tap pours water into a bottle at a steady rate; the water surface and the point of the graph stay on one line.Open
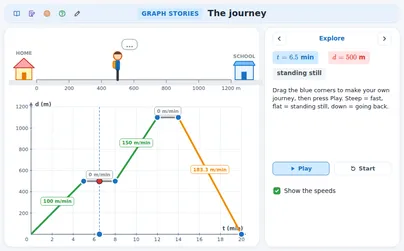 The journey: distance-time graphsThe journey: a distance–time graph and a walker on a street.Open
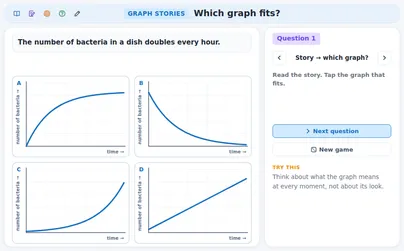 Which graph fits? (puzzles)Which graph fits?Open
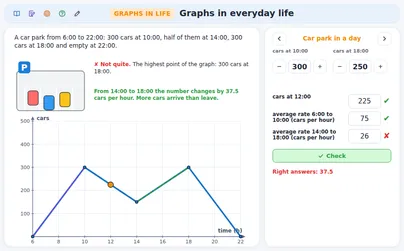 Graphs in everyday lifeRead graphs of everyday scenes with your own numbers: a bike ride, a bath, a car park, a sunflower and a lift.Open
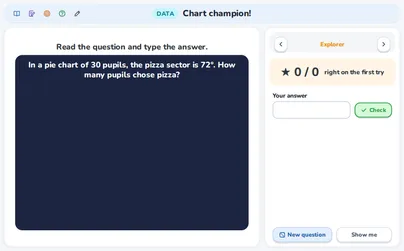 Chart champion! (quiz) QuizEndless practice with a score on the topic ‘Charts and graphs: draw, read and judge’.Open
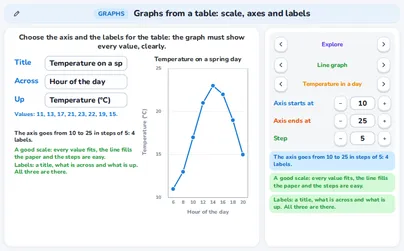 Graphs from a table: scale, axes and labelsLearn to make the choices of a graph from a table: where the axis starts and ends, the step, the title and the labels.Open
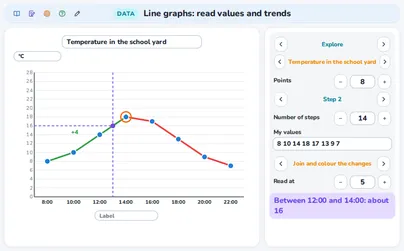 Line graphs: read values and trendsRead a line graph of a day or a plant, or make your own, and find the highest point and the biggest rise.Open
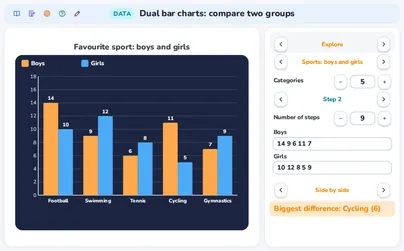 Dual bar charts: compare two groupsCompare two groups, such as boys and girls or this year and last year, with two bars in each category.OpenChart champion! (quiz) QuizEndless practice with a score on the topic ‘Charts and graphs: draw, read and judge’.Open
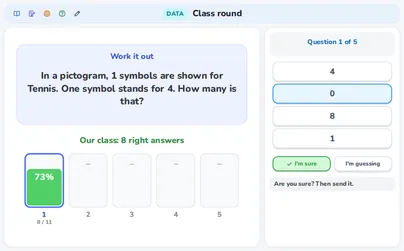 Class round: the whole class at once Class roundFive questions for the whole class at once: definitions, rules, true or myth, and sums.Open
These applications belong to the topic as a whole, not to one outcome.
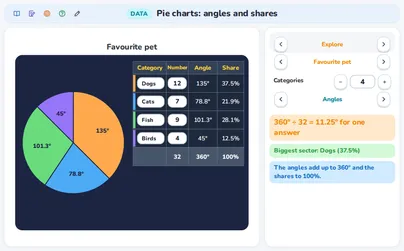 Pie charts: angles and sharesType your own names and numbers and see the angle and the share of every sector, then draw a pie by dragging the radii.Open
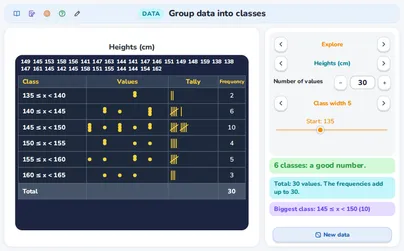 Group data into classesGroup a data set into classes, change the width and the start, and see when the picture is too rough or the table too long.Open
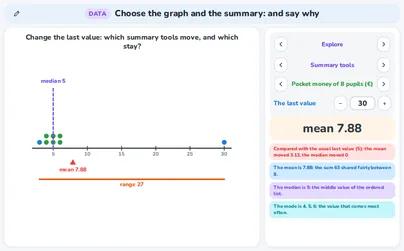 Choose the graph and the summary: and say whyChoose a small data set and change its last value.Open
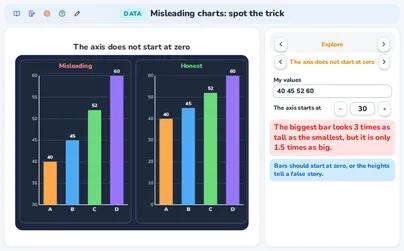 Misleading charts: spot the trickDraw your own values with a trick next to the honest chart and see how much bigger the trick makes things look.Open
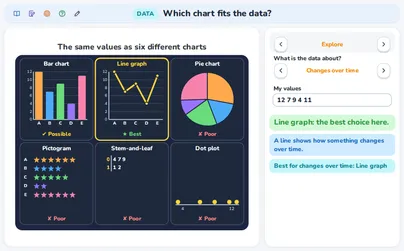 Which chart fits the data?Say what your data is about and see your values drawn as six charts, each with a verdict and a reason.OpenClass round: the whole class at once Class roundFive questions for the whole class at once: definitions, rules, true or myth, and sums.Open
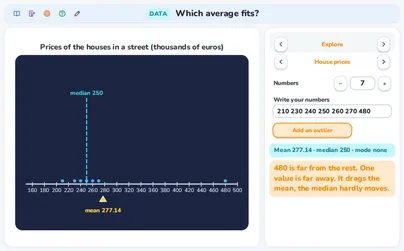 Which average fits?Pick a situation, see the mean, the median and the mode live, add an outlier and decide which average is the fair one.Open
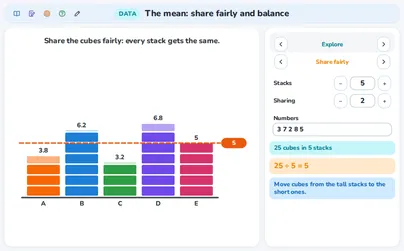 The mean: share fairly and balanceMake stacks of cubes, share them out fairly, and see the mean as a fair share and as the balance point.Open
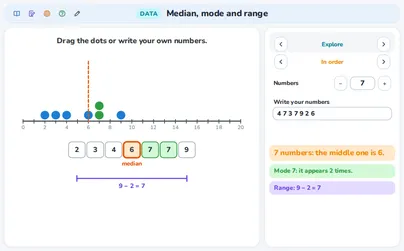 Median, mode and rangePut dots on a number line and find the median, the mode and the range of your own numbers.Open
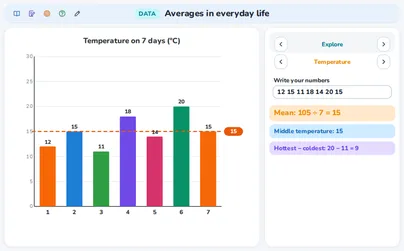 Averages in everyday lifeUse averages in four everyday scenes: pocket money, goals, quiz scores and temperatures.Open
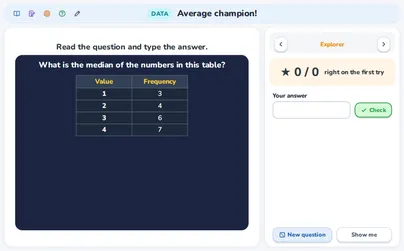 Average champion! (quiz) QuizEndless practice with a score on the topic ‘Averages and range: mean, median, mode, range’.Open
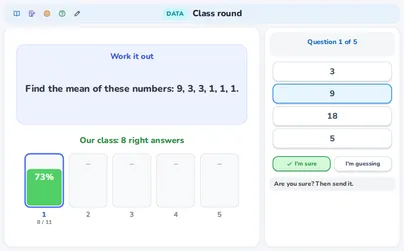 Class round: the whole class at once Class roundFive questions for the whole class at once: definitions, rules, true or myth, and sums.Open
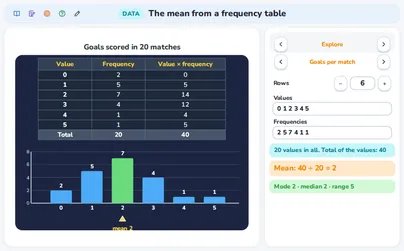 The mean from a frequency tableFill a frequency table, drag the bars and see the mean, the mode, the median and the range.Open
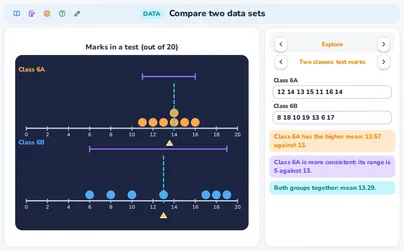 Compare two data setsPut two groups on two number lines, compare them and see the mean of both groups together.Open
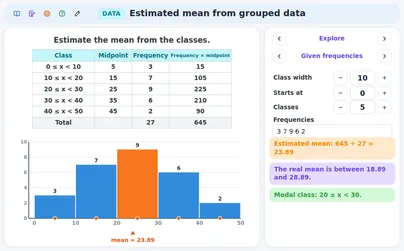 Estimated mean from grouped dataGroup data into classes of equal width, use the midpoints and see how close the estimate is to the real mean.OpenMedian, mode and rangePut dots on a number line and find the median, the mode and the range of your own numbers.OpenThe mean: share fairly and balanceMake stacks of cubes, share them out fairly, and see the mean as a fair share and as the balance point.Open
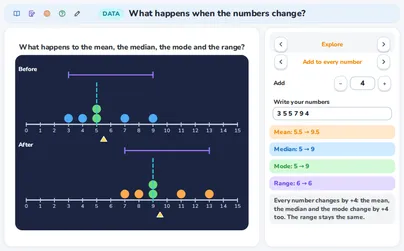 What happens when the numbers change?Change all the numbers at once, see the lanes before and after, and discover the rules for the mean, the median, the mode and the range.OpenWhich average fits?Pick a situation, see the mean, the median and the mode live, add an outlier and decide which average is the fair one.OpenAverages in everyday lifeUse averages in four everyday scenes: pocket money, goals, quiz scores and temperatures.OpenAverage champion! (quiz) QuizEndless practice with a score on the topic ‘Averages and range: mean, median, mode, range’.OpenClass round: the whole class at once Class roundFive questions for the whole class at once: definitions, rules, true or myth, and sums.Open
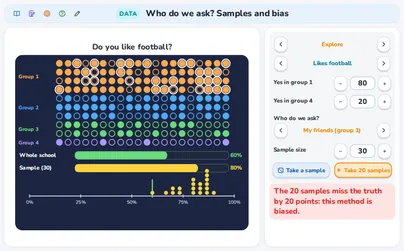 Who do we ask? Samples and biasAsk a school of 200 pupils with different plans, take samples and compare them with the whole school.Open
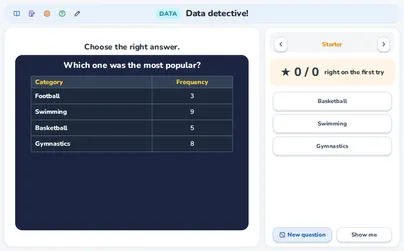 Data detective! (quiz) QuizEndless practice with a score on the topic ‘Data and questions: collect, tally, group and sample’.Open
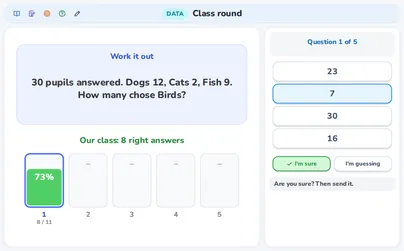 Class round: the whole class at once – Data and questions: collect, tally, group and sample Class roundFive questions for the whole class at once: definitions, rules, true or myth, and sums.OpenWho do we ask? Samples and biasAsk a school of 200 pupils with different plans, take samples and compare them with the whole school.OpenData detective! (quiz) QuizEndless practice with a score on the topic ‘Data and questions: collect, tally, group and sample’.OpenClass round: the whole class at once – Data and questions: collect, tally, group and sample Class roundFive questions for the whole class at once: definitions, rules, true or myth, and sums.Open
These applications belong to the topic as a whole, not to one outcome.
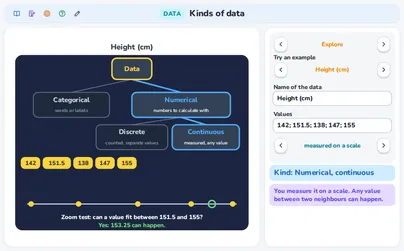
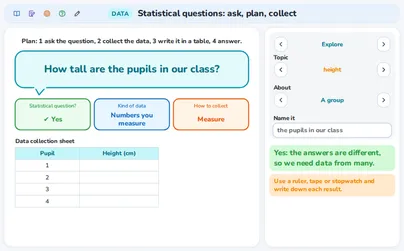 Statistical questions: ask, plan, collectAsk a question about one person or a group, and see if it is statistical, what kind of data it needs and how to collect them.Open
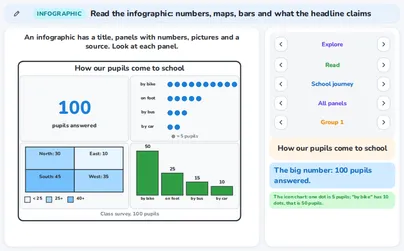
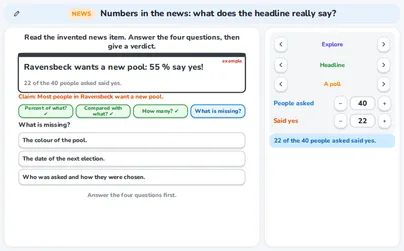 Numbers in the news: what does the headline really say?Read invented news items, ask what the numbers really say and give a verdict.Open
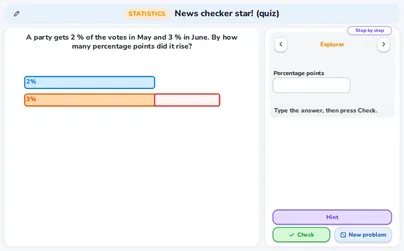 News checker star! (quiz) QuizEndless practice with a score on the topic ‘Numbers in the news: chances, percentage points and kinds of data’.Open
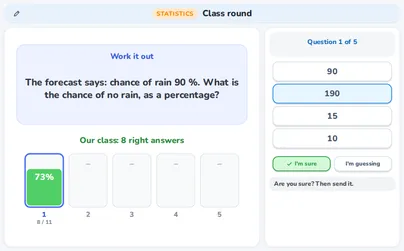 Class round: the whole class at once – Numbers in the news: chances, percentage points and kinds of data Class roundFive questions for the whole class at once: definitions, rules, true or myth, and sums.Open
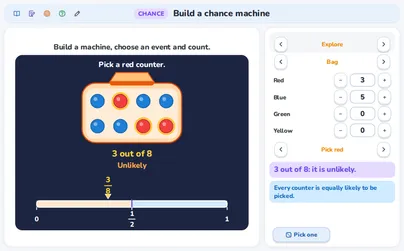 Build a chance machineBuild a bag, a spinner, a die or a coin, choose an event and count how likely it is.Open
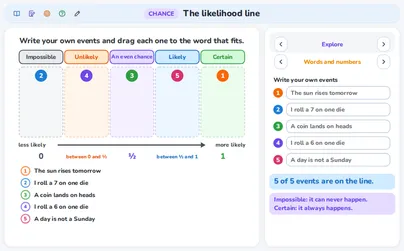 The likelihood lineWrite your own events and drag each one to the word that fits on the likelihood line.Open
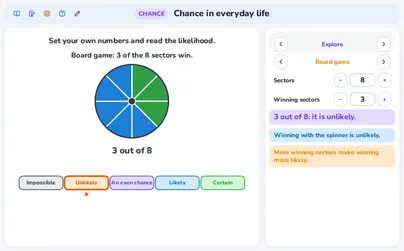 Chance in everyday lifeChoose a scene, set your own numbers and say how likely winning or rain is.Open
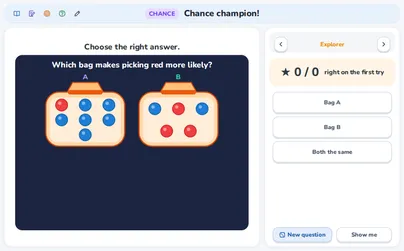 Chance champion! (quiz) QuizEndless practice with a score on the topic ‘Likelihood and the probability scale’.Open
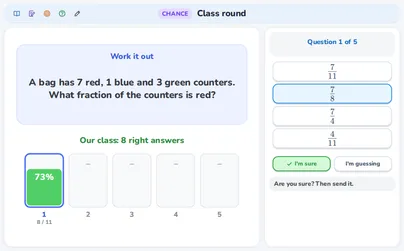 Class round: the whole class at once Class roundFive questions for the whole class at once: definitions, rules, true or myth, and sums.OpenBuild a chance machineBuild a bag, a spinner, a die or a coin, choose an event and count how likely it is.Open
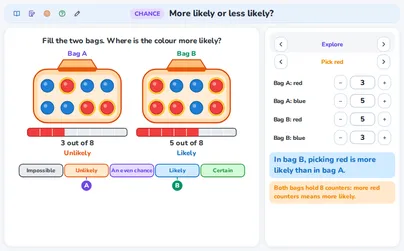 More likely or less likely?Fill two bags with red and blue counters and find where the colour is more likely: compare the shares.OpenChance in everyday lifeChoose a scene, set your own numbers and say how likely winning or rain is.OpenChance champion! (quiz) QuizEndless practice with a score on the topic ‘Likelihood and the probability scale’.OpenClass round: the whole class at once – Likelihood and the probability scale Class roundFive questions for the whole class at once: definitions, rules, true or myth, and sums.Open
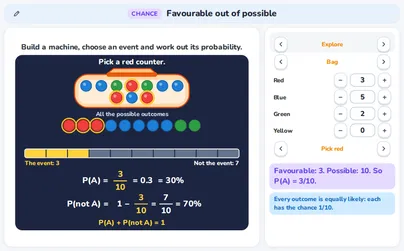 Favourable out of possibleBuild a fair machine, choose an event and see its probability: favourable out of possible.Open
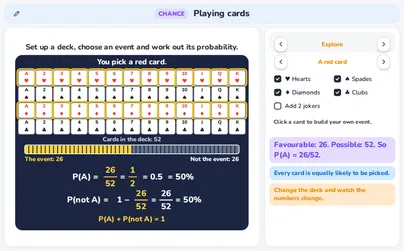 Playing cardsSet up a deck of cards, choose an event and work out its probability.Open
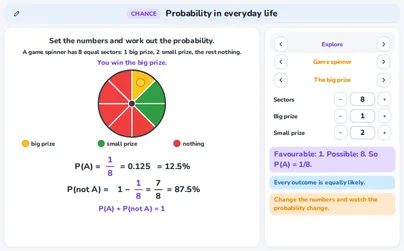 Probability in everyday lifeUse probability in everyday situations with your own numbers.Open
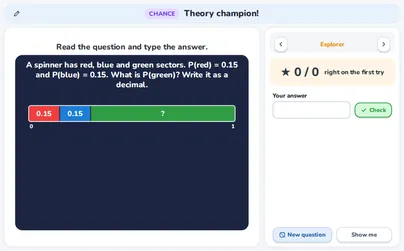 Theory champion! (quiz) QuizEndless practice with a score on the topic ‘Theoretical probability: equally likely outcomes and P(A)’.Open
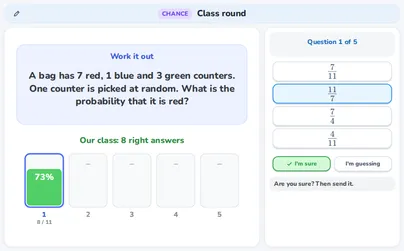 Class round: the whole class at once – Theoretical probability: equally likely outcomes and P(A) Class roundFive questions for the whole class at once: definitions, rules, true or myth, and sums.Open
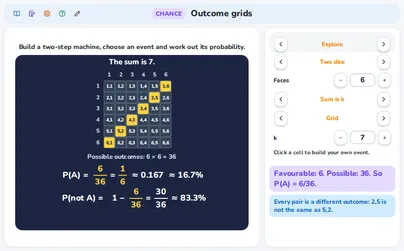 Outcome gridsBuild a two-step machine and see every outcome in a grid, a list or a table of sums.Open
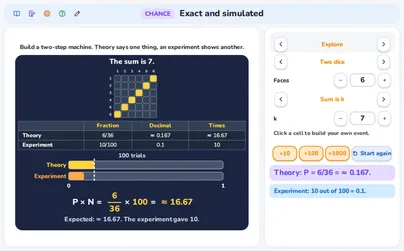 Exact and simulatedPut the exact probability of a two-step event next to a short run.Open
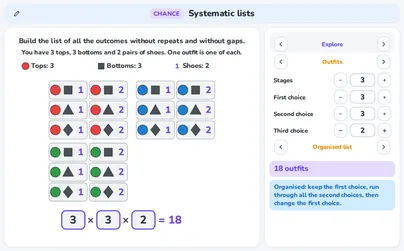 Systematic listsMake a list of all the choices, one after the other, and count them without missing any.Open
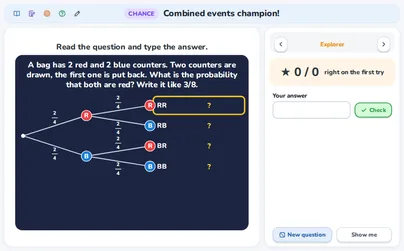 Combined events champion! (quiz) QuizEndless practice with a score on the topic ‘Combined events: grids, Venn diagrams and tree diagrams’.Open
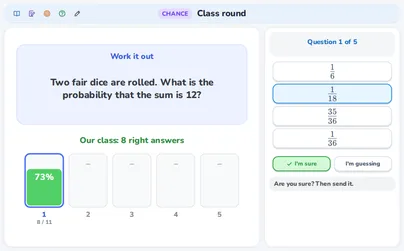 Class round: the whole class at once Class roundFive questions for the whole class at once: definitions, rules, true or myth, and sums.Open
These applications belong to the topic as a whole, not to one outcome.
Favourable out of possibleBuild a fair machine, choose an event and see its probability: favourable out of possible.OpenPlaying cardsSet up a deck of cards, choose an event and work out its probability.OpenTheory champion! (quiz) QuizEndless practice with a score on the topic ‘Theoretical probability: equally likely outcomes and P(A)’.Open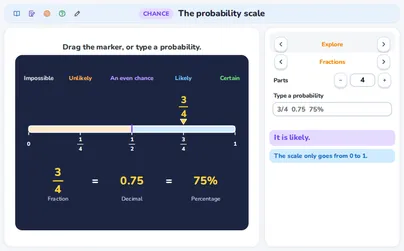 The probability scaleDrag the marker or type a probability and see its word and its three forms: fraction, decimal and percentage.Open
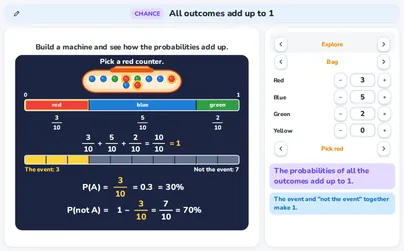 All outcomes add up to 1Build a machine and see how the probabilities of all the outcomes fill the bar up to 1.Open
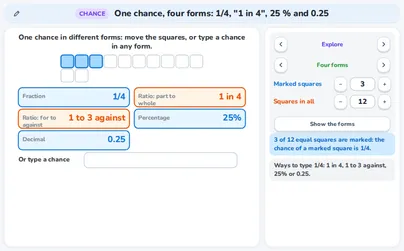 One chance, four forms: 1/4, "1 in 4", 25 % and 0.25Write one chance in four forms, tell the two ratio forms apart, read the weather forecast and compare chances.OpenThe likelihood lineWrite your own events and drag each one to the word that fits on the likelihood line.OpenMore likely or less likely?Fill two bags with red and blue counters and find where the colour is more likely: compare the shares.OpenChance champion! (quiz) QuizEndless practice with a score on the topic ‘Likelihood and the probability scale’.OpenClass round: the whole class at once Class roundFive questions for the whole class at once: definitions, rules, true or myth, and sums.OpenClass round: the whole class at once – Theoretical probability: equally likely outcomes and P(A) Class roundFive questions for the whole class at once: definitions, rules, true or myth, and sums.OpenAll outcomes add up to 1Build a machine and see how the probabilities of all the outcomes fill the bar up to 1.Open
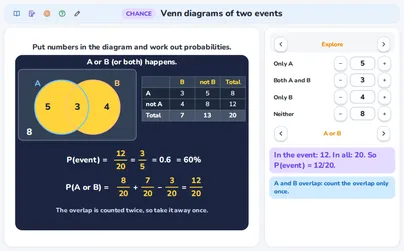 Venn diagrams of two eventsPut numbers in two overlapping circles and see the table and the addition rule.OpenTheory champion! (quiz) QuizEndless practice with a score on the topic ‘Theoretical probability: equally likely outcomes and P(A)’.OpenCombined events champion! (quiz) QuizEndless practice with a score on the topic ‘Combined events: grids, Venn diagrams and tree diagrams’.OpenClass round: the whole class at once – Combined events: grids, Venn diagrams and tree diagrams Class roundFive questions for the whole class at once: definitions, rules, true or myth, and sums.Open
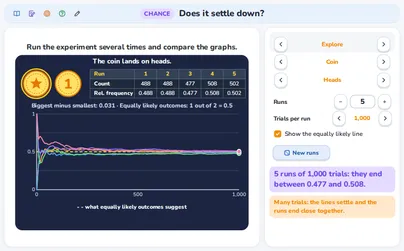 Does it settle down?Run the same experiment several times and watch the graphs settle down as the trials grow.OpenEstimate and expectType the data of an experiment to estimate the chance, or type a chance and the trials to see how often to expect it.Open
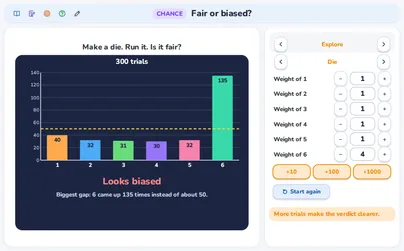 Fair or biased?Make a coin or a die, load it if you want, run the trials and decide: fair or biased?Open
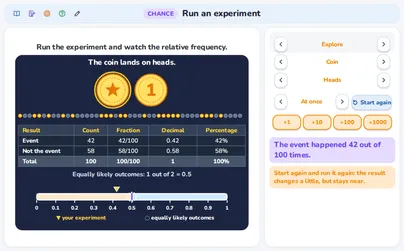 Run an experimentRun a chance experiment again and again and watch the relative frequency in the table and on the scale.OpenExperiments in everyday lifeChoose a real-life scene, type the counts of three outcomes and predict what happens next.Open
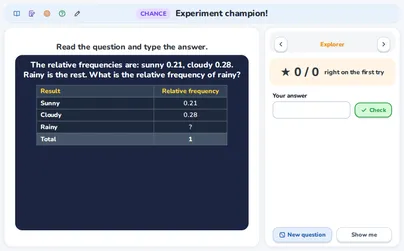 Experiment champion! (quiz) QuizEndless practice with a score on the topic ‘Experimental probability: relative frequency and expected frequency’.Open
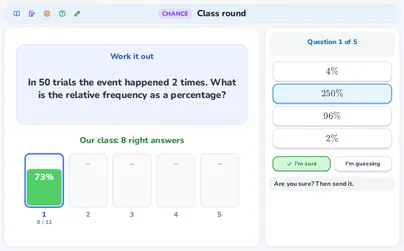 Class round: the whole class at once – Experimental probability: relative frequency and expected frequency Class roundFive questions for the whole class at once: definitions, rules, true or myth, and sums.Open
These applications belong to the topic as a whole, not to one outcome.