Definition
Reading a table
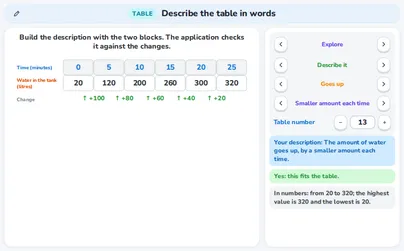
A table shows how one quantity goes with another. The top row holds the values that are chosen (here the time), the second row what follows from them (the litres of water). The row of changes under it shows what happens from one column to the next: a green + when the value goes up, a red − when it goes down and a grey 0 when it stays the same. In Read a table you pick a situation and a shape and see the table, its changes and one sentence about it.
Example
Water in a tank: after 0, 5, 10, 15, 20 and 25 minutes there are 20, 30, 40, 50, 60 and 70 litres. The changes are +10, +10, +10, +10, +10: every change is the same, so the amount of water goes up by the same amount each time.