İnteraktif Dersler

Reasoning with data

Branch 3
12topics20outcomes with applications61applications for MYP 1

Topics in this branch

← Back to the overview
3.1Simple discrete data and sorting it into groupsFully covered
Applications that cover the topic in general1

These applications belong to the topic as a whole, not to one outcome.
← Back to the overview
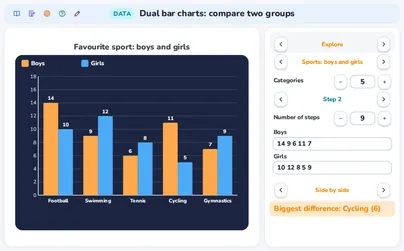
3.3Charts and graphs: bar charts, pie charts, stem-and-leaf plots and pictogramsFully covered
3.3bHistograms
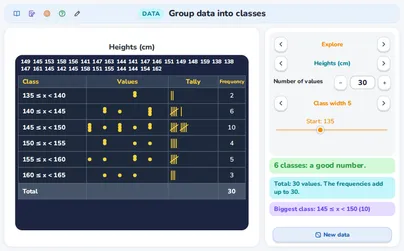
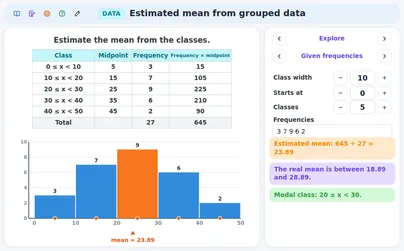
  1. 1Pupils draw and interpret histograms of grouped data, and explain how a histogram differs from a bar graph.1
3.3eStem-and-leaf plots
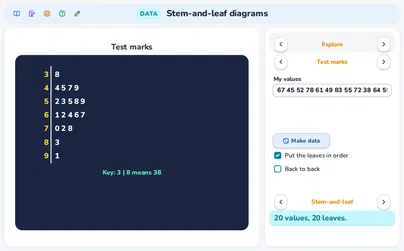
  1. 1Pupils create and interpret stem-and-leaf plots, and use them to see the shape and the spread of a data set.1
Applications that cover the topic in general1

These applications belong to the topic as a whole, not to one outcome.
← Back to the overview
3.4Data visualisations and infographicsFully covered
← Back to the overview
3.5Averages: mean, mode and median of discrete and grouped dataFully covered
3.5aMeasures of center and spread
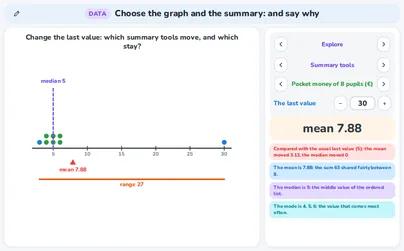
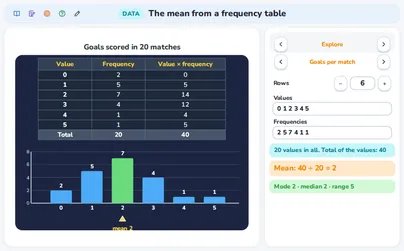
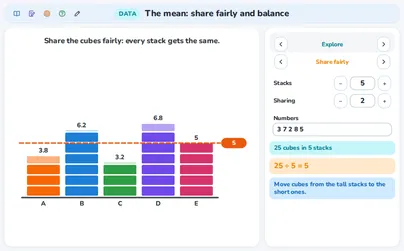
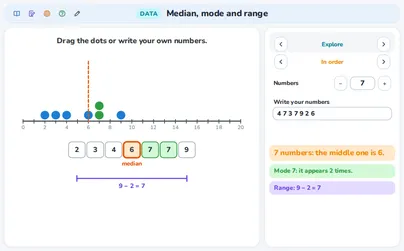
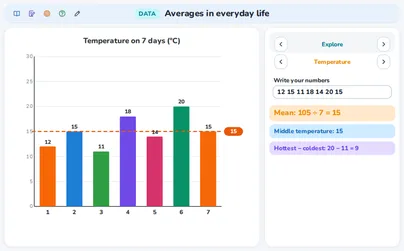
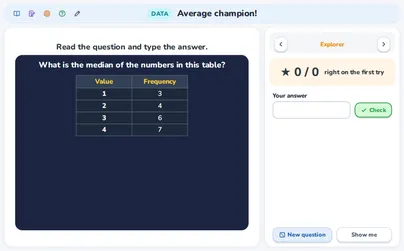
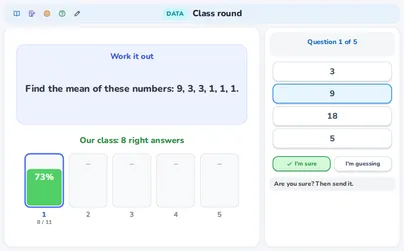
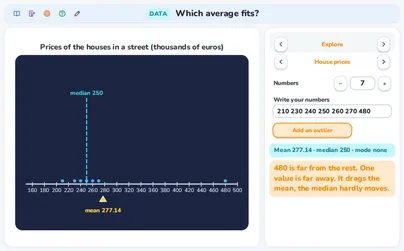
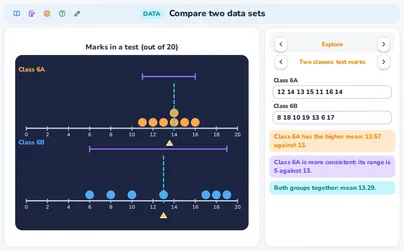
  1. 1Pupils calculate the mean, median, mode and range of a data set, read them from charts and graphs, and find a missing value that gives a required average.7
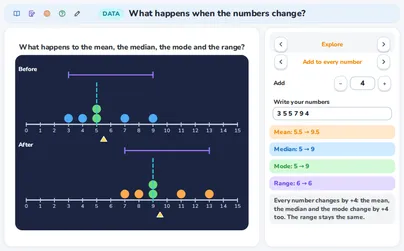
  2. 2Pupils describe how the mean, median, mode and range change when a value changes, and describe the distribution shown in a dot plot.5
← Back to the overview
3.7Context and limits of a statistical investigationFully covered
← Back to the overview
3.9Probability of simple eventsFully covered
3.9aProbability of one event
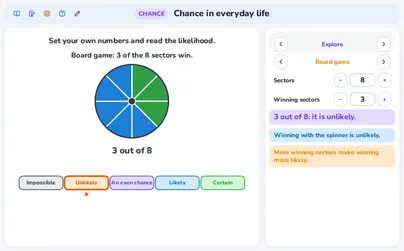
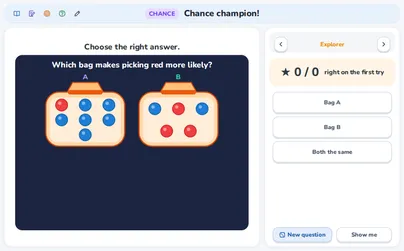
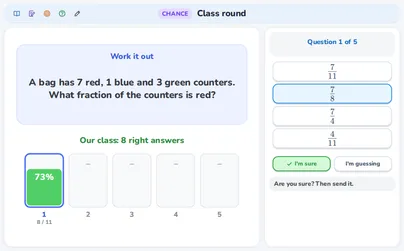
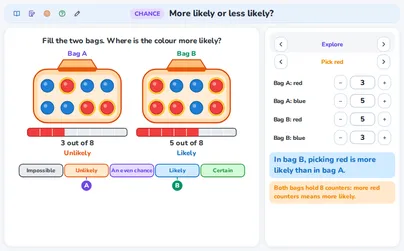
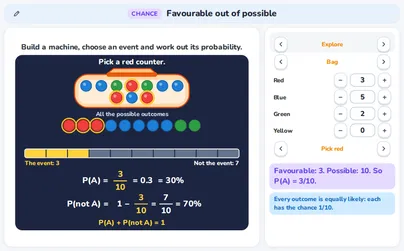
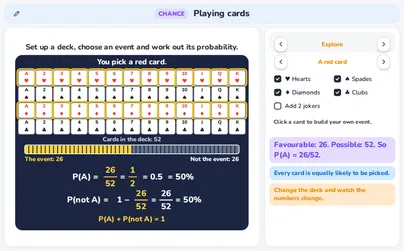
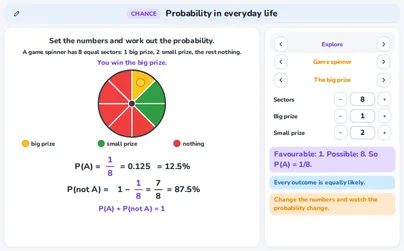
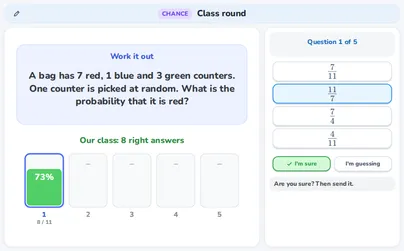
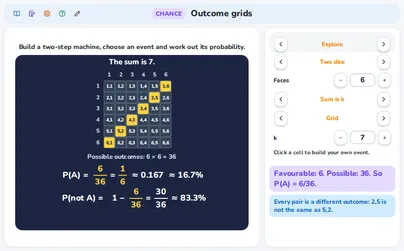
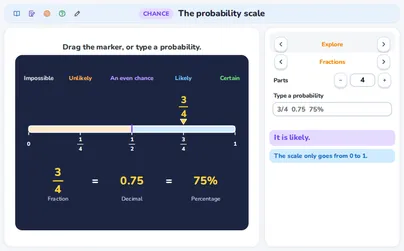
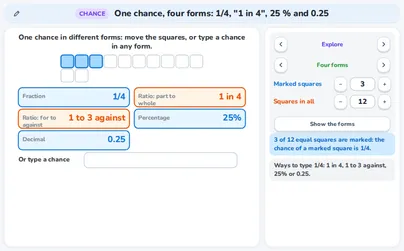
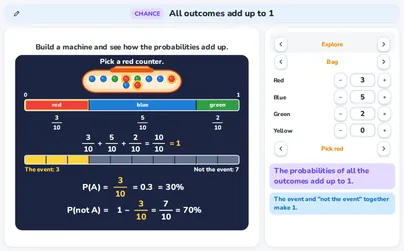
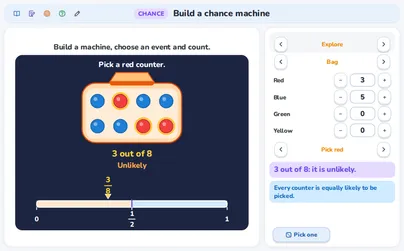
  1. 1Pupils calculate the probability of a single event as a fraction of the equally likely outcomes.10
← Back to the overview
3.12Theoretical and experimental probabilityFully covered
3.12aTheoretical and experimental probability
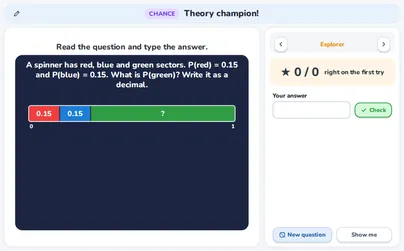
  1. 1Pupils calculate the theoretical probability of a simple event and of its opposite event.5
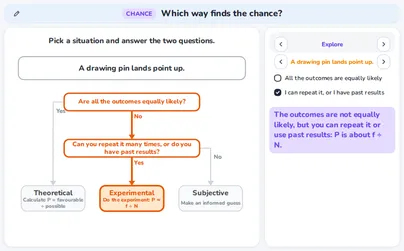
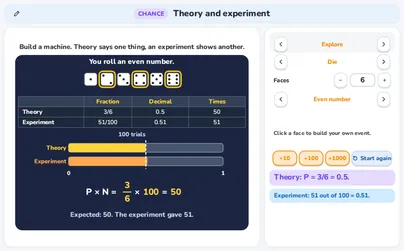
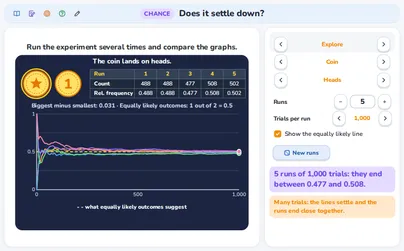
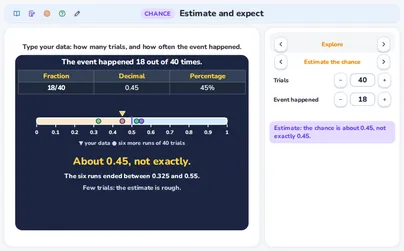
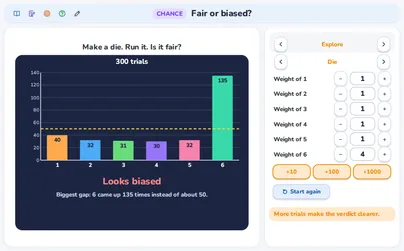
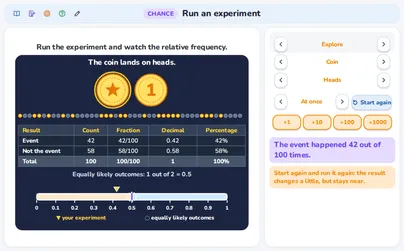
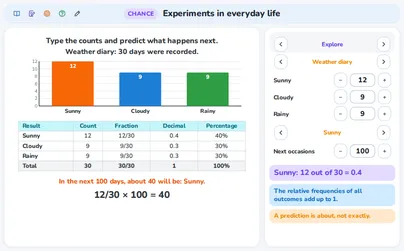
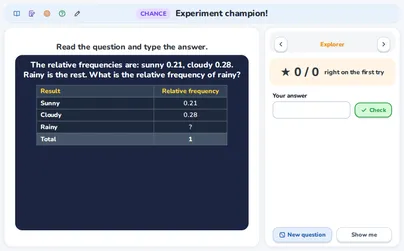
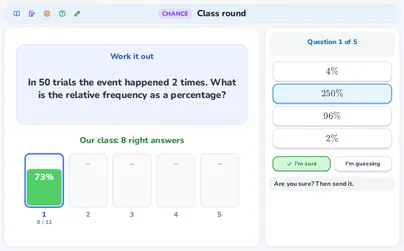
  2. 2Pupils carry out an experiment, record the results, calculate the experimental probability, and compare it with the theoretical value.9