A sample gives one number, such as the sample share p^, to estimate the true value. A point estimate is only that one number: another random sample gives another one, and nothing in the number tells how far from the truth it may be. An interval estimate gives a range of values instead: the estimate with a margin that says how much it can vary.
Example
Three random polls of 100 voters about the same plan give p^=0.49, 0.56 and 0.61. They differ by up to 0.61−0.49=0.12, and no one of them is “the” answer. An interval such as 0.56±0.0973 says how far the true share can lie from 0.56.
Definition
The confidence interval
A confidence interval is a range of values built from a random sample by a method that captures the true value in a stated share of all such samples. That share is the confidence level, for example 95%. The interval has the form estimate ± margin of error: its ends are p^−E and p^+E, where the margin of errorE is half of the width of the interval.
Example
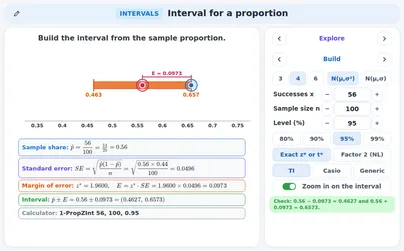
In a random sample of 100 voters 56 back a plan, so p^=0.56. The 95% interval is (0.4627,0.6573).Its centre is (0.4627+0.6573)/2=0.56, its width is 0.6573−0.4627=0.1946 and its margin of error is E=0.1946/2=0.0973.
Rule
Where the form comes from
For a random sample the sample share p^ is close to normal, with mean p and standard deviation p(1−p)/n (the sampling distribution). In 95% of random samples p^ lies within 1.96 of these standard deviations of p. Then p also lies within that distance of p^: the interval around p^ holds p. That is the whole idea of the interval.
Example
Take p=0.5 and n=100: the standard deviation of p^ is 0.5⋅0.5/100=0.05 and 1.96⋅0.05=0.0980.So the middle 95% of the sample shares lie from 0.5−0.0980=0.402 to 0.5+0.0980=0.598.
Rule
The standard error of the sample share
The true p is not known, so the standard deviation of p^ cannot be worked out. The standard error puts p^ in its place: SE = \sqrt{\dfrac{\hat p (1 - \hat p)}{n}}. It estimates how far a sample share typically lies from p, and it falls when n grows.
Example
With x=56 and n=100: p^=0.56, 1−p^=0.44.SE=0.56⋅0.44/100=0.2464/100=0.002464≈0.0496.
Rule
The critical value z*
The critical valuez∗ cuts off the middle area C of the standard normal curve, the level of the interval, and leaves (1−C)/2 in each tail. Learn the three common ones: 90%: z∗≈1.645; 95%: z∗≈1.960; 99%: z∗≈2.576. For any other level use invNorm on the calculator: the area to the left of z∗ is 1−(1−C)/2.
Example
Level 95%: each tail holds (1−0.95)/2=0.025, so the area to the left of z∗ is 1−0.025=0.975.invNorm(0.975, 0, 1)≈1.9600. In the same way z∗≈1.6449 for 90% (left area 0.95) and z∗≈2.5758 for 99% (left area 0.995).
Tip
The Dutch factor 2
The Dutch formula list writes the 95% interval with the rounded factor 2: p^±2p^(1−p^)/n. The factor 2 is a little more than 1.96, so the interval is a little wider. Use it when a task says “with the factor 2”, only at the level 95%; in every other case use the exact z∗.
Example
For 56 of 100: 2⋅0.04964≈0.0993, so the interval is (0.4607,0.6593).With 1.96 it was (0.4627,0.6573): the factor 2 is 2% larger than 1.96 and the margin grows from 0.0973 to 0.0993.
Rule
The interval for a proportion, step by step
Four steps. (1) The sample share p^=x/n. (2) The standard error SE=p^(1−p^)/n. (3) The margin of error E=z∗⋅SE. (4) The ends p^−E and p^+E. The calculator does all four at once: 1-PropZInt(x, n, C) on a TI.
Example
56 of 100 at 95%: p^=0.56; SE≈0.0496; E=1.9600⋅0.04964≈0.0973; the ends 0.56−0.0973=0.4627 and 0.56+0.0973=0.6573.Calculator: 1-PropZInt(56, 100, 0.95) gives the same interval.
Tip
The four steps of the AP answer
A full answer has four parts. Parameter: say in words what p is. Procedure: name the interval (a one-sample z-interval for a proportion). Conditions: check them with the numbers. Conclusion: the interval, the level and a sentence in context that follows the fixed frame (see Two right sentences).
Example
Poll of 100 voters, 56 in favour. p = the share of all voters who support the plan. One-sample z-interval for a proportion. Random sample; 100 is under 10% of all voters; 56≥10 successes and 44≥10 failures. Interval (0.4627,0.6573): we are 95% confident that this interval captures the true share of all voters who support the plan.
Rule
Conditions for a proportion
Check before you trust the interval. Random: the sample is random (or a randomised experiment). 10% condition: n is at most 10% of the population size N, so the draws are nearly independent. Counts: the numbers of successes np^ and failures n(1−p^) are both at least 10 (AP; some books accept 5; 9709 only asks for a large sample). If a condition fails, the interval is not justified.
Example
56 of 100: successes 56≥10 and failures 100−56=44≥10: the counts are fine.4 of 30: 4 successes is under 10 (and under 5), the 26 failures are fine: the counts fail, so the interval (0.0117,0.2550) that the formula gives is not justified.
Watch out!
The interval is rough for small counts
This interval (the Wald interval) is an approximation: p^ stands in for p in the standard error and the normal curve for the exact counts. It works well for large counts, but its real capture rate can be below the level, mostly for small counts or p near 0 or 1; if p^ is 0 or 1 it is a single point. (Not asked in any exam; shown to be honest about “approximate”.)
Example
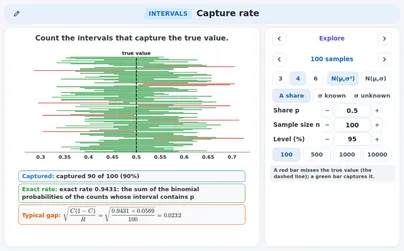
Exact capture rate of the 95% interval: for p=0.5 and n=100 it is 0.9431; for p=0.1 and n=30 only 0.8085. In the application 100 seeded samples with p=0.1, n=30 capture 0.1 in 81 cases (a run, not exact).
Rule
A higher level gives a wider interval
For the same sample a higher level needs a larger critical value z∗, so the margin of error and the width grow. You buy more confidence in the method with a less precise interval. Only a larger sample can give both: more confidence and a smaller margin (see The margin falls like 1 / √n).
Example
56 of 100 (SE≈0.04964): at 90% E=1.6449⋅SE≈0.0816; at 95% E≈0.0973; at 99% E=2.5758⋅SE≈0.1279.The intervals: (0.4784,0.6416), (0.4627,0.6573) and (0.4321,0.6879); the 99% interval is 1.314 times as wide as the 95% one.
Rule
The interval for a mean, σ known
When the population standard deviation σ is known, the sample mean has standard error σ/n and the interval is \bar x \pm z^* \cdot \dfrac{\sigma}{\sqrt n}. The margin of error is E=z∗σ/n. (9709 and the IB AI HL course use the normal distribution here.)
Example
A sample of n=36 has xˉ=102 and σ=15 is known: SE=15/6=2.5.E=1.9600⋅2.5≈4.8999, so the 95% interval is (102−4.8999,102+4.8999)=(97.1001,106.8999).
Rule
A normal population or a large sample
The sample mean is exactly normal, with mean μ and standard deviation σ/n, when the population is normal. For any population it is close to normal when n is large (the central limit theorem). That is why the rule of 9709 reads “normal population or large sample”. A larger n also makes the interval narrower: σ/n falls.
Example
With σ=15: for n=9 the standard error is 15/3=5, for n=36 it is 15/6=2.5. Four times the sample, half the standard error, so half the margin of error.
Tip
Other levels and the calculator
Any level C works: z∗ is invNorm(0.975, 0, 1) with 0.975 replaced by 1−(1−C)/2. The calculator also builds the whole interval: ZInterval(15, 102, 36, 0.95) (σ known) or TInterval(14.2, 3.1, 12, 0.95) (σ unknown); on a Casio the same are 1-Sample ZInt and 1-Sample tInt. Write the calculator call you used, not only the answer.
Example
Level 98% for the sample xˉ=102, n=36, σ=15: 1−0.02/2=0.99, so z∗=invNorm(0.99, 0, 1)≈2.3263.E=2.3263⋅2.5≈5.8159 and the interval is (96.1841,107.8159), wider than the 95% one.
Watch out!
s is not σ
The population standard deviation σ is almost never known. The sample standard deviation s is only an estimate of it, and for a small sample it can be far off. Putting s in place of σ and still using the normal critical value z∗ is a mistake: it ignores the extra uncertainty that comes from s. The answer is the t distribution (see The t distribution).
Example
Two random samples of 5 from the same population (σ=15): 96,104,100,98,102 has s2=10 and s≈3.162; 85,112,100,93,120 has s2=199.5 and s≈14.124.The two values of s differ by a factor 4.5 and neither equals 15.
Definition
The t distribution
When σ is unknown we standardise with s: t=(xˉ−μ)/(s/n). For a normal population this follows a t distribution with df=n−1degrees of freedom. A t curve is symmetric and bell-shaped like the normal curve, but its peak is lower and its tails are heavier: more area lies far from the middle. As df grows the t curve comes closer to the standard normal curve.
Example
For df=5 the area beyond ±2 is P(∣T5∣>2)≈0.1019, while for the standard normal curve it is P(∣Z∣>2)≈0.0455: the t curve has more than twice as much in its tails.
Rule
The critical value t*
The critical value t∗ cuts off the middle area C of the t curve with df=n−1. It is larger than z∗ because the tails are heavier, and it falls towards z∗ as df grows. At 95%: t∗=12.706 for df=1, 2.571 for df=5, 2.228 for df=10, 2.042 for df=30, and 1.960 (the value of z∗) for very large df. The calculator gives it with invT(0.975, df).
Example
A sample of n=12 has df=12−1=11, and at 95% the area to the left is 1−0.05/2=0.975: t∗=invT(0.975, 11)≈2.2010, clearly more than 1.960.
Tip
Reading the printed table
The Cambridge formula list prints t∗ for the upper-tail probability p. Choose the row ν=df and the column p=1−(1−C)/2: for 95% that is the column 0.975. The table shows three decimals (four figures for large values); the calculator gives more digits.
Example
n=12 at 95%: row df=11, column p=0.975: 2.201. The calculator gives 2.2010, which rounds to the same three decimals.
Rule
The interval for a mean, σ unknown
When σ is unknown use the sample standard deviation s and the t distribution: \bar x \pm t^* \cdot \dfrac{s}{\sqrt n}, \qquad df = n - 1. The standard error is SE=s/n and the margin of error is E=t∗⋅SE. The IB guide uses this rule for every sample size when σ is unknown.
Example
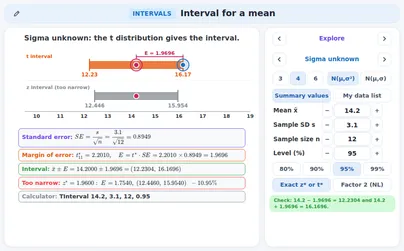
xˉ=14.2, s=3.1, n=12: SE=3.1/12=3.1/3.4641≈0.8949, df=11, t∗=2.2010.E=2.2010⋅0.8949≈1.9696, so the 95% interval is (12.2304,16.1696). Calculator: TInterval(14.2, 3.1, 12, 0.95).
Watch out!
z instead of t gives a narrower interval
With s and a small n, the normal critical value z∗ is smaller than t∗, so the interval comes out too narrow: it looks more precise than it is. With σ unknown always use t∗ with df=n−1. The narrower the sample, the larger the difference; for large n the two critical values are almost equal.
Example
For xˉ=14.2, s=3.1, n=12: with z∗ the margin is 1.9600⋅0.8949≈1.7540, giving (12.4460,15.9540), against E=1.9696 and (12.2304,16.1696) with t∗.The z interval is about 11% narrower than it should be.
Rule
Matched pairs
When the data are matched pairs (a before and an after for the same route or person), subtract inside each pair and treat the differences as one sample: xˉd, sd and n = the number of pairs, df=n−1, and the interval xˉd±t∗sd/n. Say which way you subtracted. If 0 lies inside the interval, “no difference” is plausible.
Example
Six routes, times before 34,29,41,38,27,36 and after 31,28,37,36,26,32 minutes. Before − after: 3,1,4,2,1,4; xˉd=15/6=2.5, sd2=1.9, sd≈1.3784, SE≈0.5627.df=5, t∗=2.5706, E≈1.4465: the interval (1.0535,3.9465) does not hold 0.
Rule
Conditions for a mean
Check three things. Random: a random sample (or a randomised experiment). 10% condition: n is at most 10% of the population. Shape: the population is normal, or the sample is large (n≥30 in AP), or a small sample has data without strong skew and outliers. The rules differ a little: 9709 asks for a normal population or a large sample, the IB guide assumes a normal population, AP looks at the size and at the data.
Example
A sample of 40 delivery times: 40≥30, so the size rule is met (still look for extreme values). A sample of 12 is under 30: the data must be looked at, with a dot plot (see Checking the shape) before the t interval is trusted.
Tip
Checking the shape: the fences
For a small sample draw a dot plot and look for strong skew and outliers. A value is an outlier by the 1.5×IQR rule when it lies below Q1−1.5⋅IQR or above Q3+1.5⋅IQR (the fences; the quartiles are the medians of the lower and the upper half). An outlier in a small sample means the t interval is not justified.
Example
Data 12,14,15,15,16,17,18,40 (n=8): Q1=14.5, Q3=17.5, IQR=3, fences 14.5−1.5⋅3=10 and 17.5+1.5⋅3=22.40>22 is an outlier: it lifts s to 8.93 (without it s≈1.98). Do not use the t interval for these data.
Rule
Which interval?
Ask what the data are. A share (successes out of n): the z interval for a proportion. A mean with σ known: the z interval xˉ±z∗σ/n. A mean with σ unknown: the t interval with s and df=n−1. Matched pairs: the t interval on the differences. Then check the conditions of that interval.
Example
“56 of 100 say yes”: a share, so (0.4627,0.6573). “Mean 102, σ=15 known, n=36”: the z interval (97.1001,106.8999). “Mean 14.2, s=3.1, n=12”: the t interval with df=11, (12.2304,16.1696).
Definition
What “95% confident” means
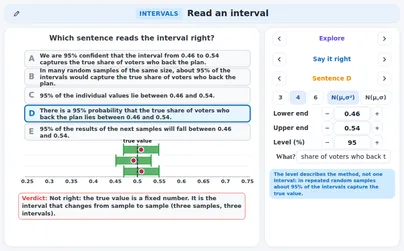
The level describes the method. If we took many random samples of the same size and built an interval from each, about 95% of those intervals would capture the true value. One interval is a hit or a miss and we cannot tell which: the 95% is the long-run capture rate of the method. The interval is the random thing; the true value is a fixed number.
Example
The application draws 100 seeded samples of 100 from p=0.5 and makes a 95% interval from each: 94 of them capture 0.5, 6 miss (other runs gave 90 and 95). The exact capture rate of this method is 0.9431, the sum of the binomial probabilities of the counts whose interval holds 0.5.
Rule
The interval moves, the true value stays
The true value of the population is one fixed number, even when we do not know it. Every random sample gives its own estimate and so its own interval: it is the interval that changes from sample to sample. Some intervals capture the true value and some miss it, and in real life we never see which.
Example
Suppose the true share is 0.5 (a pollster does not know it). Three polls of 100 give p^=0.56, 0.46 and 0.63 and the 95% intervals (0.4627,0.6573), (0.3623,0.5577) and (0.5354,0.7246). The first two capture 0.5; the third has lower end 0.5354>0.5 and misses it.
Rule
Two right sentences
Two sentences say it right, and in both the interval is the subject that captures. The frame of AP and the IB guide: “We are C confident that the interval from a to b captures the true (parameter, in context).” The repeated-sampling frame: “In many random samples of the same size, about C of the intervals would capture the true (parameter, in context).” Always name the parameter in context, not just “p”.
Example
For the poll with (0.4627,0.6573): “We are 95% confident that the interval from 0.4627 to 0.6573 captures the true proportion of all voters who support the plan.” And: “In many random samples of the same size, about 95% of the intervals would capture the true proportion of all voters who support the plan.”
Watch out!
Misreading 1 (WRONG): the individual values
WRONG: “95% of the individual values lie between a and b.” Verdict: the interval is about one number, the true value of the population, not about the data. With a larger sample the interval gets narrower, while the values keep their spread, so fewer and fewer of them lie inside.
Example
Six readings 12.1,11.8,12.4,12.0,12.2,11.9: xˉ≈12.0667, s≈0.2160, t∗=2.5706 (df=5), 95% interval (11.8400,12.2934). Only 4 of the 6 readings lie inside it; 11.8,12.4 lie outside. That is far below 95%, and with more readings it would be fewer.
Watch out!
Misreading 2 (WRONG): a probability for this interval
WRONG: “There is a 95% probability that the true proportion lies between a and b.” Verdict: the true value is a fixed number and, once the sample is taken, the interval is fixed too: it holds the true value or it does not. The 95% belongs to the method before the sample is drawn, as the share of intervals that capture the true value in the long run.
Example
Take the first 20 of the 100 seeded intervals (p=0.5, n=100): 17 capture 0.5 and 3 miss it. Each one is a hit or a miss; none of them is “95% a hit”. The 95% appears only over many intervals: 94 of all 100 captured.
Watch out!
Misreading 3 (WRONG): the next samples
WRONG: “95% of the results of the next samples will fall between a and b.” Verdict: the interval is centred on the sample result of this one sample, not on the true value, so later results fall around the true value and only part of them lands in this interval. A probability about the next sample result is a different statement, with a different number.
Example
From 56 of 100 we got (0.4627,0.6573). If the true share is 0.5, the next sample count X of 100 is binomial with p=0.5, and the next p^ falls in this interval when 47≤X≤65 (since 0.47>0.4627 and 0.65<0.6573).Exactly P(47≤X≤65)≈0.7570, about 76% of the next samples, not 95%.
Watch out!
Misreading 4 (WRONG): the true value moves
WRONG: “The true mean changes from sample to sample, and in 95% of the samples it moves into the interval.” Verdict: the true mean μ never moves. It is the sample, and so the interval, that changes. A picture of intervals jumping around a fixed line is the right picture.
Example
The true mean is μ=100 with σ=15 and n=36 (E=4.8999). Samples with xˉ=103, 98 and 106 give (98.1001,107.8999), (93.1001,102.8999) and (101.1001,110.8999).μ=100 stays on its line in all three; the third interval has lower end 101.1001 and misses it.
Rule
Why the level works: the same event
The two statements ∣xˉ−μ∣≤z∗⋅SE and “μ lies in the interval xˉ±z∗⋅SE” say the same thing: xˉ and μ are at most z∗⋅SE apart. Since xˉ is within z∗⋅SE of μ in a share C of random samples, a share C of the intervals capture μ. That is where the level comes from.
Example
μ=100, σ=15, n=36: z∗⋅SE=4.8999. If xˉ=103: ∣103−100∣=3≤4.8999 and the interval (98.1001,107.8999) holds 100. If xˉ=106: 6>4.8999 and the interval (101.1001,110.8999) does not. The two statements are true together or false together.
Watch out!
z with s captures less than the level
Build the 95% interval with s and z∗=1.96 from small samples and fewer than 95% of the intervals capture the true mean: the exact rate is P(∣Tn−1∣<1.96). The t interval captures exactly at the level. The shortfall is large for small n and fades as n grows.
Example
Exact rates with z∗=1.96: n=5: 0.8784; n=10: 0.9184; n=30: 0.9403. In the application 100 samples of 5 from N(100;152): z∗ with s captures 90, t∗ captures 96 (the picture shows the first 40: 36 and 38).
Watch out!
An interval does not repair a biased sample
The margin of error only measures random variation. If the sample is not random (volunteers, whoever is easy to reach) the interval is built around a biased estimate: a large n makes it narrow and makes it more wrongly sure. The level is true only for random samples. No formula, level or sample size repairs a bad sampling method.
Example
A website asks visitors to vote and 3100 of 5000 volunteers say yes: p^=0.62, SE≈0.00686, E≈0.0135, the interval (0.6065,0.6335) is very narrow. If the share of all voters is 0.5, the interval is far from it: 0.5<0.6065.
Rule
The margin falls like 1 / √n
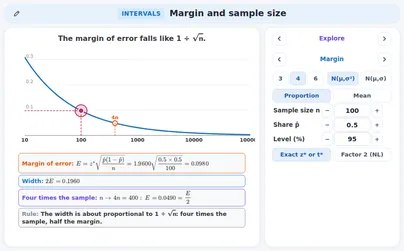
The margin of error E=z∗⋅SE contains n in the denominator (SE=p^(1−p^)/n or s/n). So four times the sample gives half the margin, and a hundred times the sample a tenth. A narrower interval is paid for with many more observations.
Example
With p^=0.5 at 95%: n=100 gives E=1.9600⋅0.25/100≈0.0980; n=400 gives 0.0490; n=1600 gives 0.0245.Each step multiplies n by 4 and divides E by 2.
Rule
The sample size for a proportion
To get a margin of error of at most m, solve z∗p^(1−p^)/n≤m for n: n \ge \left(\dfrac{z^*}{m}\right)^2 \hat p (1 - \hat p). Substitute, work out the number, then round up to the next whole number: a smaller n would give a margin above m. Check the margin with the n you chose.
Example
Margin m=0.03 at 95% with p^=0.5: z∗/m=1.9600/0.03≈65.332, squared ≈4268.29, times 0.5⋅0.5=0.25: n≥1067.07, so n=1068.Check: n=1067 gives E≈0.030001>0.03, but n=1068 gives E≈0.029987≤0.03.
Tip
The safe value p = 0.5, and the factor 2
Before the sample is taken p^ is not known. The product p(1−p) is largest, 0.25, at p=0.5, so p=0.5 is the safe choice that never gives too small an n; a good guess for p gives a smaller n. The Dutch formula list uses the factor 2 for z∗ (at 95% only): n≥(2/m)2⋅p(1−p).
Example
For m=0.03 at 95%: with p=0.5, n≥1067.07, so 1068. If p≈0.2 is a good guess, p(1−p)=0.16 and n≥682.93, so 683. With the factor 2 and p=0.5: (2/0.03)2⋅0.25≈1111.11, so 1112.
Rule
The sample size for a mean, and rounding up
For a mean with σ known (or guessed): z∗σ/n≤m gives n \ge \left(\dfrac{z^* \sigma}{m}\right)^2. Always round up, never to the nearest: 216.08 becomes 217, not 216. Rounding down breaks the promise of the margin.
Example
σ=15 and margin m=2 at 95%: z∗σ/m=1.9600⋅15/2≈14.6997, squared n≥216.08, so n=217.Check: n=216 gives E≈2.0004>2; n=217 gives E≈1.9958≤2.
Rule
Trade-offs: level, margin and sample size
Three things pull against each other: the level, the margin and the sample size. A higher level or a smaller margin needs a larger n; halving the margin needs four times n; going from 90% to 99% needs about 2.45 times n. You cannot have a high level and a small margin from a small sample.
Example
Sample sizes for p=0.5: margin 0.05: 271 at 90%, 385 at 95%, 664 at 99%. Margin 0.03: 752, 1068, 1844.At 95% a margin of 0.02 needs 2401 and a margin of 0.01 needs 9604, which is 4⋅2401. The ratio of the 99% to the 90% values is (2.5758/1.6449)2≈2.45.
Tip
A margin from simulation
The margin of error can also be found by simulation (CCSS S-IC.B.4): take many random samples of the same size from a population with the known share p, work out each sample share, and read off the middle 95% of the values. Half the distance between its ends is the simulated margin. It lands near the formula value, but not exactly: the simulation has its own random error.
Example
The application draws 1000 seeded samples of 100 from p=0.5: the middle 95% of the p^ values runs from 0.4100 to 0.5902, so the simulated margin is 0.0901. The formula gives 1.96⋅0.05=0.0980. They are close; the gap of 0.0079 comes from the 1000 repeats and from p^ moving in steps of 0.01.
Rule
Plausible values and claims
To judge a claimed value, look at the interval. A value inside the interval is plausible: the data do not rule it out. A value outside the interval is not supported by the data. A plausible value is not proved: other values inside the interval are just as plausible, so the data cannot choose between them.
Example
The interval (0.4627,0.6573) from 56 of 100. Claim 0.5: inside (0.4627<0.5<0.6573), plausible, not ruled out. Claim 0.6: inside, plausible too: the data cannot choose between 0.5 and 0.6. Claim 0.7: 0.7>0.6573, outside, not supported.
Watch out!
Overlapping intervals do not settle a difference
When two group intervals overlap you cannot conclude that the groups do not differ. The right comparison is an interval for the difference itself (a later topic, the intervals of two groups). It is narrower than the two intervals put together. If two intervals do not overlap at all, the groups clearly differ; the other way round does not hold.
Example
Two groups of 36 with σ=15: means 50 and 58, E=4.8999 each, intervals (45.1001,54.8999) and (53.1001,62.8999) overlap from 53.1001 to 54.8999. For the difference 58−50=8 the standard error is 2⋅2.5≈3.5355, E≈6.9295 and the interval (1.0705,14.9295) does not hold 0: the groups do differ.
Tip
Everyday: an opinion poll
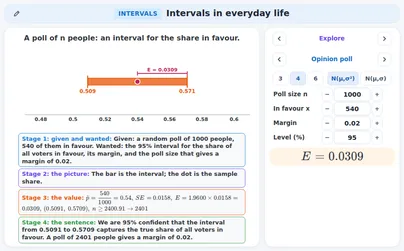
A poll reports a share with a margin of error, “52%±3.1 points”. The margin of error is the E of the interval, and its size depends on n: about a thousand people give about three points. A lead smaller than the margin is not a clear lead: the interval still holds 50%.
Example
A random poll of 1000 people: 520 in favour, p^=0.52, SE≈0.01580, E≈0.0310 (3.1 points). The 95% interval is (0.4890,0.5510): it holds 0.5, so “a majority” is not supported.A margin of 0.04 needs n≥600.23, so a poll of 601 people.
Tip
Everyday: lab readings
Repeating a measurement gives readings that vary a little. Their mean estimates the true value of the quantity, and the t interval says how well. More readings narrow the interval, but slowly: the margin falls like 1/n and t∗ also gets smaller.
Example
Six readings give xˉ≈12.0667 and (11.8400,12.2934) with E≈0.2267. With four times as many readings (n=24, df=23, t∗=2.0687) and the same xˉ and s≈0.2160: E≈0.0912, about 0.40 of the old margin.
Tip
Everyday: a factory check
A random sample of items is checked and the defective ones are counted: a share, so the interval for a proportion. Check the counts: both the number of defective and the number of good items should be at least 10. A small share needs a large sample for a small margin, because the interval is narrow only when n is big.
Example
12 defective in 300 items: p^=0.04, counts 12≥10 and 288≥10. SE≈0.01131, E≈0.0222, the 95% interval (0.0178,0.0622).For a margin of only 0.01 with p≈0.04: n≥1475.12, so 1476 items.
Tip
Everyday: delivery times before and after
Times on the same routes before and after a change are matched pairs. Subtract inside each route (before − after, so a positive difference means faster) and build the t interval of the differences. If 0 is outside the interval, the change is supported; if it is inside, “no change” is plausible.
Example
Eight routes, differences 3,1,5,1,4,−1,3,5 minutes: sum 21, xˉd=2.625, sd≈2.1339, SE≈0.7545, df=7, t∗=2.3646, E≈1.7840.The 95% interval is (0.8410,4.4090): it does not hold 0, so the times did go down.
Tip
Which course asks what
Cambridge 9709 (Paper 6): the interval for a mean and an approximate interval for a proportion; the formula list MF19 prints the critical values. IB AI HL (AHL 4.16): normal if σ is known, t if not; the IB AA course has no confidence intervals (not examined at IB AA). AP Statistics (units 3 and 4): conditions, interpretation, claims, sample size. CCSS S-IC.B.4: a margin of error by simulation. Dutch wiskunde A: the statement with its reliability, the formula list with the factor 2. No UK A level, GCSE or IGCSE course asks for a confidence interval.
Example
9709: the z interval for a mean and the interval for a share. IB AI HL: also the t interval and the calculator. AP: the four steps of the answer. Dutch: the factor 2 and a sample size (1112 for a margin of 0.03).
Exercises
A random poll of 200 people finds 110 in favour of a plan. Find the sample share p^ and the standard error SE. Easy
Show solution
The sample share is p^=110/200=0.55.
Then p^(1−p^)=0.55⋅0.45=0.2475 and divided by n: 0.2475/200=0.0012375.
SE=0.0012375≈0.0352.
p^=0.55 and SE≈0.0352
Check → 0.0352⋅0.0352≈0.00124, which is 0.0012375 rounded.
For the poll of 200 people with 110 in favour, give the 95% confidence interval for the share of all voters in favour (4 decimal places). Easy
Show solution
SE≈0.0352 and z∗=1.9600 for 95%.
The margin of error is E=1.9600⋅SE≈0.0689.
The ends are 0.55−0.0689=0.4811 and 0.55+0.0689=0.6189.
(0.4811,0.6189)
Check → at 90% the margin is smaller (0.0579), at 99% larger (0.0906): the 95% value lies between them.
Which interval? (a) 38 of 120 buses were late. (b) The mean of 50 readings is known to have σ=2.4. (c) The mean of 15 pupils’ times, with s from the sample. Name the interval and the degrees of freedom if it has any. Easy
Show solution
(a) is a share: the z interval for a proportion.
(b) is a mean with σ known: the z interval xˉ±z∗σ/n.
(c) is a mean with σ unknown: the t interval with df=15−1=14.
(a) z interval for a proportion; (b) z interval for a mean; (c) t interval, df=14
Check → only (c) uses s from a sample, so only (c) needs t∗.
A 95% interval for a share is (0.42,0.58). Find the sample share and the margin of error. Easy
Show solution
The sample share is the centre: (0.42+0.58)/2=0.5.
The width is 0.58−0.42=0.16.
The margin of error is half the width: 0.16/2=0.08.
p^=0.5 and E=0.08
Check → 0.5−0.08=0.42 and 0.5+0.08=0.58.
Find the critical value t∗ from the printed table: (a) a 95% interval from a sample of 8; (b) a 99% interval from a sample of 20. Easy
Show solution
(a) df=8−1=7; at 95% the column is p=1−0.05/2=0.975: t∗=2.365.
(b) df=20−1=19; at 99% the column is p=1−0.01/2=0.995: t∗=2.861.
(a) 2.365; (b) 2.861
Check → both are larger than the matching z∗ (1.960 and 2.576), as they must be for a small df.
A 95% interval for a mean is (97.1,106.9). Find the sample mean and the margin of error. Is the value 100 plausible? Is 110? Easy
Show solution
The sample mean is the centre: (97.1+106.9)/2=102.
The margin of error is half the width: (106.9−97.1)/2=4.9.
100 lies inside (97.1<100<106.9): plausible. 110>106.9 lies outside: not supported.
xˉ=102, E=4.9; 100 is plausible, 110 is not supported
Check → 102−4.9=97.1 and 102+4.9=106.9. That 100 is plausible does not prove that μ=100.
A random sample of 25 has mean 48 and the population standard deviation is known to be 6. Find the 95% interval for the mean (4 decimal places). Medium
Show solution
SE=σ/n=6/5=1.2.
E=1.9600⋅1.2≈2.3520.
The interval is 48−2.3520=45.6480 to 48+2.3520=50.3520.
(45.6480,50.3520)
Check → the calculator ZInterval(6, 48, 25, 0.95) gives the same ends.
The same sample (mean 48, n=25) has sample standard deviation s=6, and σ is not known. Find the 95% interval and compare its margin with the previous one. Medium
Show solution
df=25−1=24 and t∗=2.0639 at 95%.
SE=s/n=6/5=1.2 and E=2.0639⋅1.2≈2.4767.
The interval is (45.5233,50.4767); the margin is 2.4767−2.3520=0.1247 larger than with z∗.
(45.5233,50.4767); the margin 2.4767 is a little larger than 2.3520
Check → t∗=2.0639>1.9600=z∗ for df=24.
In a random sample of 40 pupils, 6 walk to school. May the 95% interval for a proportion be used? Say what you conclude. Medium
Show solution
The counts: successes 6 and failures 40−6=34. AP asks both at least 10: 6<10 fails.
The formula would give p^=0.15, SE≈0.0565, E≈0.1107 and the interval (0.0393,0.2607).
With AP’s rule the counts fail, so the interval is not justified
No: only 6 successes (under 10), so the interval (0.0393,0.2607) is not justified
Check → 6+34=40, and 6/40=0.15.
A margin of error of at most 0.05 is wanted for a share at 95%, and nothing is known about p. How large must the sample be? Medium
Show solution
With nothing known use the safe value p=0.5: p(1−p)=0.25.
n≥(z∗/m)2⋅0.25=(1.9600/0.05)2⋅0.25≈384.15.
Round up: n=385.
n=385
Check → 384.15 is not a whole number and the sample size must be at least that: round up, never down.
A 95% interval for the proportion of students who walk to school is (0.31,0.45). Write the conclusion in the fixed frame, in context. Medium
Show solution
Name the parameter in words: the proportion of all students who walk to school.
The interval is the subject that captures: “the interval from 0.31 to 0.45 captures the true proportion”.
Add the level as “We are 95% confident that …” and the context.
We are 95% confident that the interval from 0.31 to 0.45 captures the true proportion of all students who walk to school.
Check → the centre is (0.31+0.45)/2=0.38 and the margin (0.45−0.31)/2=0.07; the sentence is about the interval, not about the students.
Five pupils take a test before and after a lesson; the differences (after − before) are 4,7,−1,5,5. Find the 95% interval for the mean difference. Is 0 plausible? Medium
Show solution
xˉd=(4+7−1+5+5)/5=20/5=4. Squares of the deviations: 0+9+25+1+1=36, sd2=36/4=9, sd=3.
SE=3/5≈1.3416, df=5−1=4, t∗=2.7764, E≈3.7250.
The interval is (0.2750,7.7250); 0 lies below it, so “no change” is not supported.
(0.2750,7.7250); 0 is not plausible
Check → 0.2750>0; the calculator TInterval(4, 3, 5, 0.95) agrees.
A pupil writes for the interval (0.31,0.45) about the proportion of students who walk to school: “There is a 95% probability that the true proportion is between 0.31 and 0.45.” This is WRONG. Explain why and write a right sentence. Hard
Show solution
The true proportion is one fixed number; the drawn interval is fixed too, so it holds it or it does not.
The 95% belongs to the method: in many random samples about 95% of the intervals capture it.
A right sentence: “We are 95% confident that the interval from 0.31 to 0.45 captures the true proportion of all students who walk to school.”
The interval is the random thing and the true value is fixed; the 95% describes the method. Right sentence: see the last step
Check → in the right sentence the interval is the subject that captures.
The standard deviation of a population is 15. How large a sample gives a 99% margin of error of at most 2? Compare it with the 95% sample size. Hard
Show solution
At 99%: z∗=2.5758.
n≥(z∗σ/m)2=(2.5758⋅15/2)2≈373.21.
Round up: n=374, against 217 at 95% (from 216.08).
n=374 at 99%, against 217 at 95%
Check → the ratio (2.5758/1.9600)2≈1.73 and 216.08⋅1.73≈374, near 374.
The poll of 1000 people with 520 in favour is worked with the Dutch factor 2. Find the interval, and compare it with the interval that uses z∗=1.96. Hard
Show solution
p^=0.52 and SE≈0.01580.
With the factor 2: E=2⋅0.01580≈0.0316, the interval (0.4884,0.5516).
With z∗: E≈0.0310 and (0.4890,0.5510); the factor 2 interval is a little wider.
Factor 2: (0.4884,0.5516); with z∗: (0.4890,0.5510)
Check → 2>1.96, so the margin with the factor 2 (0.0316) is larger than 0.0310; both intervals hold 0.5.
A sample of 5 has xˉ=20 and s=4. Find the 95% interval with t∗, then the one a pupil gets with z∗=1.96. How much wider is the correct interval (in %)? Hard
Show solution
SE=4/5≈1.7889; df=4, t∗=2.7764, E≈4.9667: the interval is (15.0333,24.9667).
With z∗: E≈3.5061 and (16.4939,23.5061).
The margins are in the ratio 2.7764/1.96≈1.417: the correct interval is about 41.7% wider.
about 41.7% wider: (15.0333,24.9667) against (16.4939,23.5061)
Check → the z interval with s captures the true mean in only about 87.8% of such samples.
A poll of 400 people has margin 0.049 at 95% (with p=0.5). The pollster wants half this margin and a 99% level. How many people are needed, and how many times the old n is that? Hard
Show solution
The new margin is 0.049/2=0.0245 and z∗=2.5758.
n≥(2.5758/0.0245)2⋅0.25≈2763.39, so n=2764.
Compared with 400: 2764/400≈6.91 times; halving the margin alone gives 4 times (to 1600 at 95%), and the 99% level adds the rest.
n=2764, about 6.91 times the old sample
Check → 4⋅1.73≈6.9, where 1.73≈(2.5758/1.9600)2.
Two groups of 36 have means 50 and 58 and the known σ=15 in both. Their 95% intervals overlap. Does that show that the groups do not differ? Use the interval for the difference 58−50 with standard error 2⋅15/6 (a later topic). Hard
Show solution
Each group has E=4.8999: (45.1001,54.8999) and (53.1001,62.8999) overlap.
For the difference 8: SE=2⋅2.5≈3.5355 and E=1.9600⋅3.5355≈6.9295.
The interval (1.0705,14.9295) does not hold 0, so the groups do differ although the group intervals overlap.
No: the difference interval (1.0705,14.9295) excludes 0, so overlap does not settle it
Check → 1.0705>0. (The point: overlapping group intervals do not settle it.)
A small sample has the values 3,5,6,6,7,8,9,25. Is a t interval for the mean justified? Use the fences of the 1.5×IQR rule. Hard