İnteraktif Dersler

Models, representations and spreadsheets

Lecture notes

Definition

A model is a simpler picture of a situation

A model is a simpler picture of a situation that helps you to answer a question: a drawing, a table, a formula or a sheet. It keeps what the question needs and leaves the rest out on purpose. The situations in the applications are original: we wrote them for these pages, and the numbers change from one round to the next, so a classmate may get other numbers.
Example
A school yard is 24 m by 15 m with a round pond in it. The model is a rectangle with a circle taken away. The colour of the gate and the age of the head teacher are not in the model.
24 m15 m360 m²
Definition

A fact matters when the question needs it

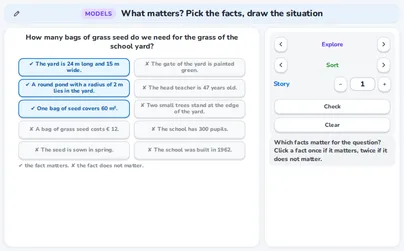
A fact is relevant when you need it to answer the question; the other facts do not matter. In the tab Sort a story has 10 facts and a question. Click a fact once if it matters and twice if it does not, then press Check. There are 6 stories. Several facts are true and still do not matter.
Example
How many bags of grass seed for the yard? The facts that matter are 24 m by 15 m, the round pond with a radius of 2 m and one bag covers 60 m². That is 3 facts of 10. The gate, the head teacher’s age, the two trees, the price of the seed and the 300 pupils do not matter.
Rule

The same fact can matter for one question and not for another

Whether a fact matters depends on the question. In the tab Same question one situation has two questions and 8 facts. You mark the facts for the question that is shown, then switch to the other question and mark again. The same fact may be ticked for both.
Example
A garden is 12 m long and 8 m wide, with a gate of 1 m. The fence needs the length, the width and the gate → . The grass seed needs the area and what a bag covers → , and with 24 m² a bag that is 4 bags. The gate matters for the fence, not for the seed.
12 m8 m96 m²
Watch out!

Sometimes a fact is missing

A story can have too few facts: you cannot answer the question yet. In Sort the application names the missing fact after Check when there is one: 2 of the 6 stories miss a fact. A missing fact is a fact you need and do not have. A number that you do not use is not a missing fact.
Example
How long does the bus journey to the zoo take? The zoo is 90 km away and the bus stops for 20 minutes. The average speed of the bus is missing. Suppose it is 60 km/h → hours, which is 90 minutes. Add the break → minutes, or 1 hour 50 minutes.
Rule

Simplify: turn a plan into a model drawing

A plan has more shapes than the model needs. In the tab Simplify you move the shapes of a plan to the lines Add and Take away, or leave them out; the application draws your model to scale and shows its area. There are 4 plans of 6 shapes. A circle uses 3.14, so the area of a pond is a model of the pond.
Example
School yard: add the yard of 24 m by 15 m and take away the pond, a circle with a radius of 2 m. and , so the grass is . With 60 m² a bag, is about 5.79, so you buy 6 bags: 5 bags are not enough.
Rule

Draw: the numbers are tested, not the looks

In the tab Draw you draw a situation on a grid of 13 by 5 points by moving dots with the pointer or the arrow keys. The application tests the numbers of the structure (distances, one row, a depth), never whether the drawing looks nice. The rules appear as cards and turn green when they hold. There are 3 situations.
Example
A bus stop and a school are 600 m apart and 1 square is 100 m. Put both dots on one horizontal line, 6 squares apart → . A pool is 12 m long, 1 m deep at the shallow end and 3 m deep at the deep end: the two top corners are 12 squares apart, and the bottom dots are 1 and 3 squares below them.
0246810126AB
Tip

Leave facts out on purpose

A model that leaves out facts is not wrong: it is simple enough to use. More facts do not make a better model; facts that do not matter only get in the way. Before you calculate, cross out what the question does not need. If the answer is the same without a fact, the fact did not matter.
Example
How much flour for 12 pancakes? The recipe makes 4 pancakes with 100 g of flour. , so . The 2 eggs, the width of the pan, the age of the cook and the price of flour are not used: only 2 of the 10 facts matter.
Definition

Six model families

In the tab Match a situation comes with a table of numbers. You pick the family that fits: Ratio table, Straight line through zero, Straight line, Inverse proportion, Table of values or No model fits, and then a reason out of 6. The application works out the kind of every situation from its numbers: the reason is judged against what the numbers do. There are 8 situations, each with 9 sets of numbers.
Example
Phone plan: start fee and a price a month, a straight line. Plant that grows 2 cm a week from 5 cm, a straight line. A bill shared by friends, inverse. A recipe, through zero. Visitors of a shop on seven days, jumping up and down: no model fits.
Rule

Proportional: twice the number, twice the amount

In a proportional situation twice the number gives twice the amount, and 0 gives 0: the line goes through zero. A ratio table shows it: multiply or divide both numbers of a column by the same factor. Check with a division: the amount divided by the number is the same for every column.
Example
A recipe needs 25 g of flour for each person. 2 people need , and 14 people need 7 times that → . The amount divided by the number is 25 in every column.
n1214g2550350×2×2×7×7
Rule

A start amount: a straight line that misses zero

When an amount goes up by the same step every time but there is an amount at the start, the model is a straight line that does not go through zero. Twice the number does not give twice the amount: the start amount does not double. The amount divided by the number is not the same in every column.
Example
A taxi charges a start fee of 3 euros and 2 euros for every kilometre. 5 km cost euros. 1 km costs 5 euros and 2 km cost 7 euros → but , so the fare is not proportional. 0 km still costs 3 euros.
024685101520kilometres€
Rule

Inverse proportion: the product stays the same

In an inverse proportion the two numbers multiply to the same product. When one number doubles, the other halves. Test it: multiply the two numbers of every column. If the products are equal, the model is inverse. A shared bill is the usual example.
Example
A bill of 60 euros is shared by 3, 4, 5 and 6 friends: each pays 20, 15, 12 and 10 euros. , , and . More friends means less for each, and the product is always 60.
n3456€20151210
Rule

Test a model: where it breaks and what it says far away

In the tab Test you set the Start and the Step of a straight line against 6 data sets. The application shows the first place where the line is off by more than the tolerance, and then what the line says far away, against what the situation allows. A line can fit all the data and still say something silly far away.
Example
A plant is measured for 10 weeks. Take the line that starts at 5 cm and grows 2 cm a week, with a tolerance of 1 cm. At week 6 the line says 17 and the plant is 16 cm: 1 cm off, still fine. At week 7 the line says 19 and the plant is 17 cm: it breaks. At week 12 the line says , but a pot of 20 cm cannot hold that.
02468101214102030weekscm
Rule

Compare two models: close to the data, sensible far away

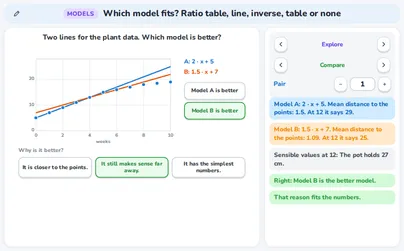
In the tab Compare two lines are drawn for the same data. A better model is close to the data and still sensible far away. The application shows the mean distance to the points and what each line says far away; you choose Model A is better or Model B is better and give a reason. Exactly one of the two has both qualities in each of the 6 pairs.
Example
The same plant data and a pot of 27 cm. Model A → · week, mean distance 1.5, but at week 12 it says 29 cm: too tall for the pot. Model B → · week, mean distance 1.09, and at week 12 it says 25 cm: fine. Model B is the better model: it is close and sensible.
024681012148162432weekscm
Rule

Where does it stop? The range of a model

A model works only for the numbers where the situation makes sense: its range. In the tab Where does it stop? you set the end of the range with a stepper and press Check. The answer is the last whole number for which the model still gives a sensible value. There are 6 situations, each with 9 sets of numbers.
Example
A plant is 5 cm tall and grows 2 cm a week in a pot of 41 cm. → week 18 still fits. → that is more than 41, so the range ends at week 18. A candle of 20 cm that burns 4 cm an hour ends at hour 5, because at hour 6 the model says −4 cm.
0481216201020304050weekscm
Definition

Six pictures for a calculation

A picture shows the structure of a calculation: what is the whole, what is a part and what is repeated. The application has 6 pictures: Number line, Double number line, Ratio table, Strip, Area model and Groups and arrays. There are 6 kinds of calculation with 9 sets of numbers each: a fraction of an amount, a percentage, a division by a fraction, a product, a subtraction with negative numbers and a percentage off.
Example
The first calculations of the six kinds are 3/4 of 24, 15% of 80, , 7 · 18, and 40% off 65. Not every picture suits every calculation: a number line is handy for jumps, a strip for a part of a whole, an area model for a product.
Rule

Strip: cut the whole into equal parts

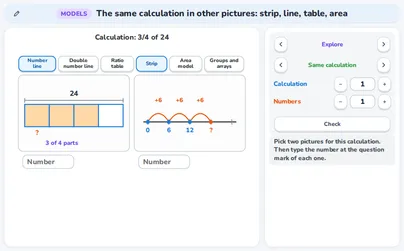
A strip is one whole cut into equal parts, with some parts shaded. In the tab Same calculation you pick two pictures for one calculation and type the number at the question mark of each. A picture that does not fit says why it does not. Two pictures, one calculation: both must give the same number.
Example
3/4 of 24: cut the strip of 24 into 4 equal parts, in each part. Shade 3 parts → . The same calculation on a double number line: 1 whole is 24, so 3/4 of 24 is 18.
666624
Rule

Double number line and ratio table: percentages

A percentage goes well on a Double number line or in a Ratio table: the percentages on one line, the amounts on the other. 100% is the whole. Find 10% by dividing by 10, and 5% by halving that, then add the pieces you need. The strip shows the same by 20 parts of 5% each.
Example
15% of 80: 100% is 80, so 10% is and 5% is . Then 15% is . On the strip of 20 parts each part is , and 15% is 3 parts → .
%10010515n808412÷10÷10÷2÷2
Rule

Number line: jumps to the right and to the left

On a Number line a calculation is a walk: a jump to the right adds, a jump to the left subtracts. Write the size above every jump and read the landing point at the end. For a product, take equal jumps: the number of jumps is one factor and the size of a jump is the other.
Example
→ start at −3 and jump 5 to the left. You land on −8. The product 7 · 18 is 7 jumps of 18 that end at 126.
−10−8−6−4−20−5−3−8
Rule

Area model: cut a number at a friendly place

An Area model shows a product as a rectangle: the sides are the factors and the area is the product. Cut one side at a friendly place, usually at a ten, and calculate the two small rectangles. In the tab Draw your own you choose where to cut. An area model needs two lengths that are multiplied; the application says so when it does not fit.
Example
7 · 18: cut the 18 into 10 and 8. and , so . It would also work with → .
107708756
Tip

Pick the picture that fits the calculation

Ask what the calculation is: a part of a whole (strip), a percentage (double number line, ratio table), jumps (number line), a product of two lengths (area model) or equal groups (groups and arrays). In the tab Which calculation? a picture is shown, you pick the calculation it shows out of 4, and then type its result.
Example
asks: how many halves fit in 24? On a double number line 1 on top is 2 on the bottom, so 24 on top is on the bottom. A groups picture agrees: 24 groups of 2 halves are 48 halves. An area model does not fit: it needs two lengths that are multiplied.
Tip

Draw your own, and swap: pictures are for sharing

In the tab Draw your own you build a picture with two steppers; the application tests the numbers of your picture (equal parts, the right number shaded), not how it looks. There are 6 tasks. In the tab Swap a classmate’s picture has something unclear. You say what is unclear and how to change it. There are 6 such pictures.
Example
A strip for 3/4 of 24 needs 4 equal parts with 3 shaded. A classmate’s strip has four parts of different sizes: the parts are not equal, so the shaded part does not tell the fraction. The good change is to draw equal parts. A picture is good when other people can read it.
The parts are not equal.
Definition

A small spreadsheet: cells, formulas and the formula bar

A sheet is a grid of cells. A cell is named by its column letter and row number, like C2. A formula starts with =; the cell shows the result and the formula is in the formula bar. The sheet of the application is small on purpose: 10 columns and 20 rows, of which 6 columns and 10 rows are in view; scroll buttons and the arrow keys move the view. Click a cell, type in the bar and press Enter formula or Enter.
Example
Prices are in column A and numbers in column B. In C2 type the formula that multiplies A2 by B2. With a price of 3 and a number of 4 the cell shows .
C2=A2*B2ABC1Price (€)NumberCost (€)234123524210583
Rule

Fill down: the row numbers move with the cell

Select a cell with a formula and press Fill down: the formula is copied to the cells below, and its row numbers move with it. A copied formula does not keep its cell names. That is why one formula fills a whole column. Add up a column with the function SUM and the range, such as C2:C5.
Example
C2 holds A2 times B2. Filled down it becomes A3 times B3, A4 times B4 and A5 times B5: the costs are , , and . The total of C2 to C5 is .
C5=A5*B5ABC1Price (€)NumberCost (€)234123521042102058324
Rule

A fixed cell: a dollar sign keeps it in place

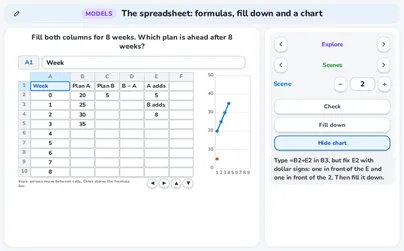
Sometimes a formula must keep pointing at the same cell when it is filled down, such as an amount that is added every week. Put a dollar sign in front of the column letter and in front of the row number of that cell: it stays where it is, and only the other cell names move. The scene Scenes has two saving plans for this.
Example
Plan A starts with 20 euros and adds 5 a week, plan B starts with 5 and adds 8. Filled down for 8 weeks, A has and B has , so B is ahead by . After 5 weeks both have 45 euros; from week 6 on B is ahead: 50 and 53.
B3=B2+$E$2ABC1WeekPlan APlan B20205312513423021012345678690
Rule

The functions have the names of the page language

The sheet knows 5 functions: SUM, AVERAGE, ROUND, MIN and MAX. Their names and the sign between the arguments follow the language of the page, and so does the decimal sign. A sheet reads a name in capitals or small letters. An unknown name gives an error with an explanation.
Example
Fuel for a trip: 240 km, 6 litres per 100 km and 1.8 euros a litre make litres and euros. For 4 people each pays . Rounded to one decimal with that is 6.5 euros.
B8=ROUND(B7, 1)AB1Distance (km)2402L per 100 km63Price per L (€)1.84People45Litres14.46Cost (€)25.927Each pays (€)6.488Rounded (€)6.5
Rule

Charts: a bar chart and a line chart

Press Show chart to see a chart of a range, and Hide chart to put it away again. Choose a Bar chart to compare amounts, or a Line chart to follow a change over time; with No chart you see only the numbers. The chart reads the cells, so it changes when a number changes.
Example
A bar chart of the costs C2 to C5 shows four bars of 12, 10, 20 and 24: the last one is the highest. A line chart of the two saving plans for 0 to 8 weeks shows two rising lines: plan A ends at 60 and plan B at 69, and the lines cross at week 5.
C2=A2*B2ABC1Price (€)NumberCost (€)234123521042102058324C2C3C4C5240
Tip

Predict first, then let the sheet show it

In the tab Predict you see a formula in a small sheet, type the value you expect in I expect and press Enter formula. The sheet then shows its own value. There are 8 items. Work the formula out by hand first: brackets, then · and ÷, then + and −; a quick estimate also shows a result that is far off.
Example
With 4 in A1 and 3 in B1 the formula shows . For the numbers 3, 5, 2 and 8, the total is and the mean is . The biggest minus the smallest is .
Watch out!

A sheet does not know what you meant

A sheet calculates exactly what you wrote, also when that is not what you meant, and a number without an error does not prove the formula is right. In the tab Fix it a sheet has a mistake in a formula or a cell; there are 6 such sheets. A division comes before an addition unless brackets say otherwise. For a broken formula the sheet shows an error such as #FORMULA! with an explanation.
Example
The mean of 7 and 8 should be 7.5. The formula divides first → . With brackets, gives . A quick check tells: a mean of 7 and 8 cannot be 11.
B1=A1+A2/2AB171128
Special case

A text in a list, a range that misses a row, a fixed cell too many

Three more mistakes are in the tab Fix it. A cell with a word in it is not a number, and a sum skips it. A range that stops one row too early leaves a number out. A dollar sign on a cell that must move gives the same result in every row. And the decimal sign of a number follows the page: a sheet in a language with a decimal comma reads as text and as a number.
Example
A4 holds the text “12 kg”. The sum of 5, 8, the text and 4 skips the text → instead of . Prices 6, 3, 9, 2 and 5 in A2 to A6 give 25, but a range A2:A5 gives . A fixed cell in the formula for the costs gives 12 in every row, instead of 12, 18, 9 and 15.
C3=$A$2*$B$1ABC1Amount3Cost (€)2412361243125512
Definition

The modelling cycle: six stages

Modelling goes round a cycle of six stages: Situation (what do I want to know?), Model (choose a model and write it), Calculate (work it out with the numbers), Interpret (say the result in the words of the situation), Check (compare it with the data or the real situation) and Improve (change the model where the check showed a flaw). In the tab Cycle there are 4 scenarios with 9 sets of numbers each.
Example
A class goes on a school trip by bus. Situation: what does the trip cost? Model: buses = pupils ÷ seats rounded up, cost = buses · price of a bus. Calculate with 60 pupils, 30 seats and 180 euros a bus → buses and euros.
Situation1Model2Calculate3Interpret4Check5Improve6
Rule

Interpret: a number alone does not answer the question

After you calculate, say what the result means in the words of the situation, with the unit. In the stage Interpret you choose the sentence that does this; the other sentences name the wrong thing (a number of pupils instead of euros, one bus instead of all). A result that is not interpreted may be taken for something else.
Example
The model gives 360. Right: by the model the buses for the class cost 360 euros in all. Wrong: the cost of the buses is 60 pupils, or one bus costs 360 euros. The number 360 is the same, but only the first sentence says what it is.
Rule

Check shows the flaw of the first model

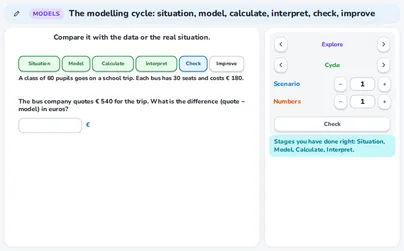
The first model of every scenario has a planted flaw: it forgets something that the real situation has. In the stage Check you compare the result with the data and the application shows the flaw. A difference is not a failure: it is information about what the model forgot.
Example
The bus company quotes 3 buses. The driver takes a seat, so only seats are free in every bus. is about 2.07, so 3 buses are needed and euros. The model said 360: the difference is euros.
Situation1✔Model2✔Calculate3✔Interpret4✔Check5!Improve6The check shows the flaw: thedriver takes a seat.
Rule

Improve and run the cycle again

In the stage Improve you change the model where the check showed a flaw, and then you run the cycle again: calculate, interpret and check the new model. A good change has a reason in the situation: changing numbers until the answer looks right is not an improvement. An improvement may need a new fact.
Example
A tap puts 40 litres a minute into a pool, 30 minutes: the model says litres, a meter shows 1 140. The difference is , so the leak is litres a minute: 120 litres an hour. The improved model agrees with the meter, and for 45 minutes it says .
Situation1✔Model2✔Calculate3✔Interpret4✔Check5!Improve6The check shows the flaw: the poolalso loses water.
Tip

Stop after any stage, and name the stages you did right

You may stop after any stage. The application shows which stages you did right and tells you when you went round the whole cycle. The tab Which stage? has 12 sentences, two for each stage, and you name the stage that each sentence belongs to. The other scenarios are a phone plan and a plant in a pot.
Example
A phone plan has 5 GB a month and costs 10 euros a month, plus 2 euros for every extra GB. Used: 3, 9 and 4 GB. Pooled, GB is extra → euros. Month by month GB are extra → euros, which is 6 euros more. A plant of 5 cm that grows 2 cm a week says after 15 weeks, but a pot of 30 cm stops it → too tall.
Situation1✔Model2✔Calculate3✔Interpret4✔Check5✔Improve6✔You went round the whole cycle.
Definition

The quiz: all five applications mixed

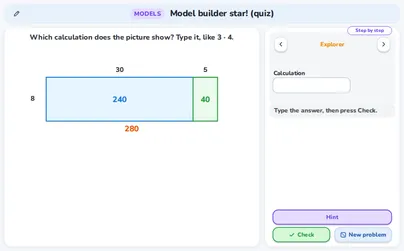
The quiz has only practice: choose Starter, Explorer or Champion and answer endless new questions from the 5 applications: the facts that matter, the model family, the calculation in a picture, the value in a sheet and the stage of the cycle. Type the number or choose the sentence and press Check. Help comes in steps: Hint, Next step and Show answer.
Example
Question kinds: count the facts that matter for a question; give the number at week 12 by a straight-line model; type the calculation that a picture of 3 rows of 4 shows (3 · 4); give the value of C4 after a fill down; give the improved value of a model after the check.
Definition

The class round: the whole class at once

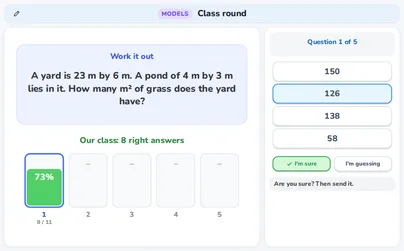
In the class round every pupil answers on their own screen. A round has 5 questions: a definition, a rule, a true-or-myth statement and two with numbers. The bank holds 4 definitions, 4 rules and 6 true-or-myth statements, and 3 generators make new numbers every time. The teacher sees how many are sure but wrong.
Example
A generator question: a yard is 20 m by 10 m with a pond of 2 m by 5 m. The grass is . A wrong option such as adds the pond to the yard, and the teacher sees that trap by name.
Tip

Keys, and nothing is sent anywhere

Everything that can be moved can also be moved with the keyboard: Tab goes to a tile, a dot or a cell, Enter (or a click) picks it up or stores it, the arrow keys move it along the line or to another place, and Esc puts it back. In the sheet the arrow keys move between cells and Enter stores the formula bar. What you type or move is checked in the browser and is sent nowhere.
Example
In Simplify press Tab to a shape, Enter to send it to the line Add, the down arrow to move it to Take away and Esc to put it back. In Draw press Tab to a dot and move it with the arrow keys. The situations are original, and the numbers change from one round to the next.

Exercises

3 pizzas of 9 euros are ordered, the delivery takes 30 minutes, the boxes are red, 6 friends share the bill equally and it rains outside. Which facts matter for “How much does each friend pay?” And how much is it? Easy
Show solution
The question needs the whole bill and the number of friends. The 3 pizzas, the 9 euros and the 6 friends matter; the delivery, the red boxes and the rain do not.
The bill is euros.
Shared by 6 → euros.
Answer → 3 facts matter; each friend pays 4.5 euros
Check → .
On a drawing 1 cm stands for 20 m. A street is 7 cm long on the drawing. Which model family fits: ratio table, straight line through zero, straight line, inverse proportion, table of values or none? How long is the street? Easy
Show solution
Twice the length on the drawing is twice the length in the street, and 0 cm is 0 m: the family is a straight line through zero (a proportional situation).
A ratio table works too: 1 cm is 20 m, so 7 cm is 7 times as much.
.
Answer → a straight line through zero; 140 m
Check → , the same for every length.
Show 2/5 of 35 on a strip. How many equal parts, what is one part and what is the answer? Easy
Show solution
The fraction has 5 in the bottom: cut the strip of 35 into 5 equal parts.
One part is .
Shade 2 parts → .
7777735
Answer → 5 equal parts of 7; 2/5 of 35 is 14
Check → parts and .
C2 holds the formula that multiplies A2 by B2 and is filled down to C5. A4 is 2 and B4 is 10. What does C4 show? Easy
Show solution
Filling down moves the row numbers with the cell: in row 4 the formula uses A4 and B4.
C4 shows A4 times B4 = .
C5=A5*B5ABC1Price (€)NumberCost (€)234123521042102058324
Answer → 20
Check → C2 would show for the first row: every row has its own numbers.
Name the stage of the modelling cycle for each sentence: (a) “Ana writes down what she wants to know before she calculates anything.” (b) “Gus says: so the trip costs 360 euros for the class.” (c) “Ivo compares his result with the real quote of the bus company.” Easy
Show solution
(a) She says what she wants to know: that is Situation.
(b) The result is said in the words of the situation: that is Interpret.
(c) The result is compared with the real quote: that is Check.
Answer → (a) stage 1, (b) stage 4, (c) stage 5
Check → the order of the six stages is Situation, Model, Calculate, Interpret, Check, Improve: the 1st, the 4th and the 5th.
A terrace around a pool: the terrace and the pool together are 12 m by 8 m, the pool is 8 m by 4 m. A chair, a sun umbrella, the steps and a pump house are also on the plan. What do you add and what do you take away? What is the area of the terrace? Medium
Show solution
Add the shape of the terrace and the pool together → .
Take away the pool → .
Leave out the chair, the umbrella, the steps and the pump house: they are small and the question does not need them.
The terrace is .
Answer → add 12 m by 8 m, take away 8 m by 4 m; the terrace is 64 m²
Check → .
A swimming trip: the bus costs 360 euros and 30 pupils go. The pool opens at 10:00, the drive takes 45 minutes, we want to arrive 15 minutes early, the pool has a slide and the bus is white. What does the trip cost for each pupil? At what time must we leave? Medium
Show solution
The cost needs the price of the bus and the number of pupils → euros each.
The time needs the opening time, the drive and the early arrival: the slide and the white bus do not matter.
We must be there 15 minutes before 10:00 and the drive takes 45 minutes → minutes before 10:00.
So we leave at 9:00.
Answer → 12 euros for each pupil; leave at 9:00
Check → , and minutes + 15 minutes = 10:00.
A bill of 72 euros is shared equally by 6 friends. Which model family fits? What does each friend pay? What does each pay when 9 friends share it? Medium
Show solution
More friends means less for each: the family is an inverse proportion, and the product of the number of friends and what each pays is always 72.
With 6 friends → euros each.
With 9 friends → euros each.
Answer → inverse proportion; 12 euros with 6 friends and 8 euros with 9 friends
Check → and .
In a sheet A1, A2 and A3 hold 2, 3 and 5, and B1, B2 and B3 hold 4, 4 and 2. C1 holds the formula that multiplies A1 by B1 and is filled down to C3. What does C3 show? And what does the formula show? Medium
Show solution
In row 3 the filled-down formula multiplies A3 by B3 → .
The formula with the function for rounding first works out , which is about 2.333.
Rounded to one decimal that is 2.3.
Answer → C3 shows 10, and the formula shows 2.3
Check → 2.3 is the nearest tenth of 2.333 → is more than 2.3 and less than 2.35.
Use a ratio table to find 35% of 40. Medium
Show solution
Start with 100% is 40.
10% is and 5% is .
35% is three times 10% and once 5% → .
%10010535n404214÷10÷10÷2÷2
Answer → 14
Check → .
A plant is 5 cm tall and grows 2 cm a week by the model. The pot is 20 cm tall. Up to which whole week does the model make sense? What does the model say at week 12? Hard
Show solution
The model is height = · week. The height must not be more than the pot, 20 cm.
Week 7 → fits. Week 8 → is more than 20: too tall.
So the range ends at week 7.
02468101214102030weekscm
At week 12 the model says → silly for a pot of 20 cm.
Answer → week 7; at week 12 the model says 29 cm
Check → at week 7, and at week 8.
The savings of a box in the weeks 0 to 8 are 12, 17, 22, 27, 32, 37, 42, 47 and 52 euros. Model A is · week and model B is · week. The box holds up to 500 euros. Which model is better, and why? Hard
Show solution
Model A gives 12, 17, 22, … 52 for the weeks 0 to 8: distance 0 to every point.
Model B gives 10, 16, 22, … 58: the distances are 2, 1, 0, 1, 2, 3, 4, 5 and 6, together 24. The mean distance is , about 2.67.
At week 20 A says and B says → both are under 500, so both are sensible. Only the distance to the data tells them apart.
Answer → model A: it is closer to the data, and both are sensible far away
Check → for A, and for B is 6 too much.
The prices 6, 3, 9, 2 and 5 are in A2 to A6. B7 holds the formula . What does B7 show, and what should it show? Write the right formula. Hard
Show solution
The range A2:A5 stops one row too early: it holds 6, 3, 9 and 2, and B7 shows .
The total of all five prices is .
The range must go down to A6, so the formula is .
Answer → B7 shows 20 and should show 25; the formula is =SUM(A2:A6)
Check → .
Use an area model for 7 · 26. Where do you cut the 26, what are the two small areas and what is the product? Hard
Show solution
Cut the 26 at the ten → .
The two rectangles are and .
2071406742
The product is .
Answer → cut at 20 and 6; the areas are 140 and 42; the product is 182
Check → .
A class of 75 pupils goes on a school trip. A bus has 25 seats and costs 150 euros, and the driver takes a seat. What does the first model say the trip costs? What does the improved model say? How big is the difference? Hard
Show solution
The first model forgets the driver → buses and euros.
The driver takes a seat, so only seats are free in every bus. 3 buses seat , which is less than 75, so is about 3.12 and 4 buses are needed.
The improved model costs euros.
The difference is euros.
Answer → first model 450 euros; improved model 600 euros; difference 150 euros
Check → , which is at least 75.
Are you a teacher?

Start live lessons with these applications for your whole class. Free to try for one month.

Try it free

Fits these school years

IB (MYP, Diploma): MYP 1, MYP 2, MYP 3, MYP 4

Cambridge International: Lower Secondary, stage 7, Lower Secondary, stage 8, Lower Secondary, stage 9, IGCSE

Netherlands: Groep 7, Groep 8, Year 1, Year 2, Year 3 (havo, vwo), Vmbo kb (years 3-4), Vmbo gt (years 3-4), Vmbo bb (years 3-4), Havo · Mathematics A, Havo · Mathematics B, Vwo · Mathematics A, Vwo · Mathematics B, Vwo · Mathematics C

Türkiye (MEB): Year 5 (MEB), Year 6 (MEB), Year 7 (MEB), Year 8 (MEB), Year 9 (MEB)

England (GCSE, A Level): Year 7, Year 8, Year 9, Year 10 (GCSE)

USA (Common Core): Grade 6, Grade 7, Grade 8, Algebra 1

What the applications of this topic teach 7 applications

What matters? Pick the facts, draw the situation

  • Telling which facts of a story matter for the question
  • Turning a plan into a model drawing and finding its area
  • Drawing a situation on a grid with the numbers that matter

Which model fits? Ratio table, line, inverse, table or none

  • Choosing a model from the numbers: ratio table, line, inverse
  • Testing a straight line against data
  • Comparing two models and where a model stops making sense

The same calculation in other pictures: strip, line, table, area

  • Showing one calculation in several pictures: line, table, strip, area
  • Reading the calculation and result from a picture
  • Drawing a picture for a calculation with the right numbers

The spreadsheet: formulas, fill down and a chart

  • Typing numbers and formulas in a sheet and reading cells by name
  • Filling a formula down and keeping one cell fixed
  • Making a chart from the cells of a sheet

The modelling cycle: situation, model, calculate, interpret, check, improve

  • Naming the six stages of the modelling cycle
  • Calculating with a model and stating the result in context
  • Checking a model against data and improving it

Model builder star! (quiz), primary school edition

  • Answer questions on the 2 applications of this edition: the facts that matter and the same calculation in more than one picture.

Class round, primary school edition: the whole class at once

  • I know what a model is and what a relevant fact is.
  • I know how a ratio table and a strip work.
  • I know that more facts do not always make a better model and that the same calculation can be drawn in more than one way.