Data: collect, tally, group and sample
Lecture notes
Variable, group and kind of data
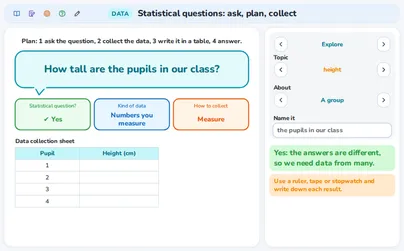
Four ways to collect data
The data collection sheet
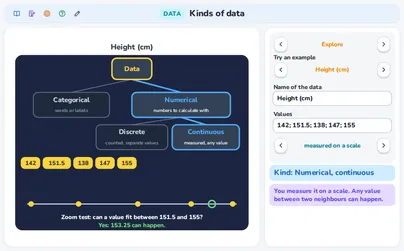
Categorical and numerical data
Numbers used as labels
Discrete and continuous data
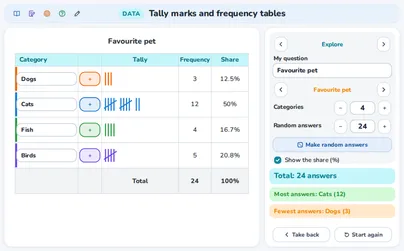
Tally marks in fives
The frequency table and its total
Reading a table
The share in %
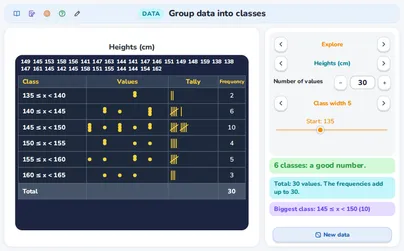
Grouping data into classes
Population and sample
Fair and biased samples
Response rate and who answers
The fair mix
Estimating from a sample
Samples differ
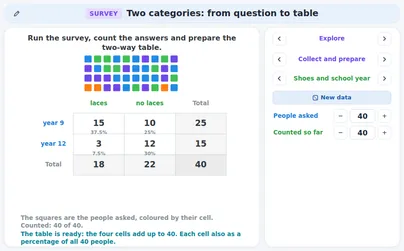
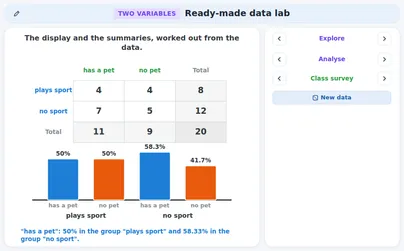
Two-way table
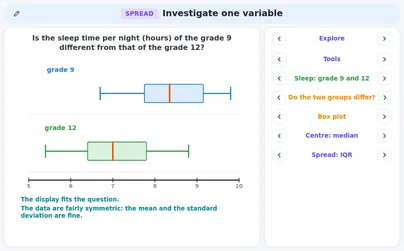
Investigating one variable
The five kinds of question
Which display and which summary fit
Reading a conclusion: supported or not supported
Question ready-made data
What comes next
Exercises
Show solution
Show solution
Show solution
Show solution
Show solution
Show solution
Interactive applications for this topic
Free applications open with a free student account. Teachers can use all applications in a live lesson.
DemoStatistical questions: ask, plan, collect
PlusTally marks and frequency tables
PlusKinds of data: categorical, discrete, continuous
PlusGroup data into classes
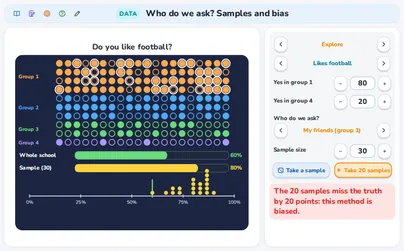
PlusWho do we ask? Samples and bias
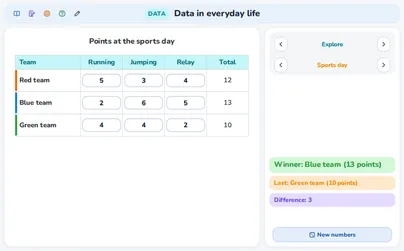
PlusData in everyday life
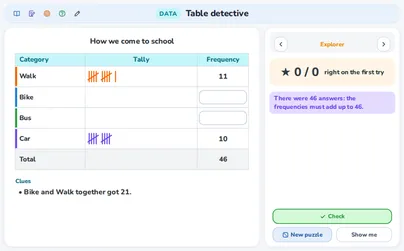
PlusTable detective
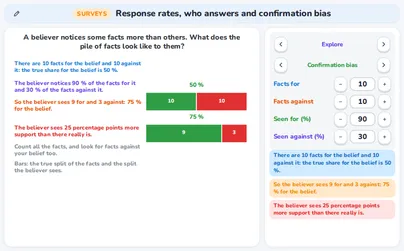
PlusResponse rates, who answers and confirmation bias
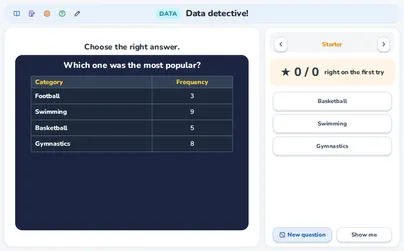
PlusData detective! (quiz)
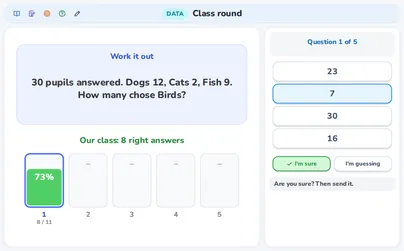
PlusClass round: the whole class at once
PlusTwo categories: from question to table
PlusInvestigate one variable
PlusReady-made data lab Start live lessons with these applications for your whole class. Free to try for one month.
Try it freeFits these school years
IB (MYP, Diploma): PYP, MYP 1, MYP 2, MYP 3, MYP 4, MYP 5, Diploma, year 1, Diploma, year 2
Cambridge International: Primary, stage 4, Primary, stage 5, Primary, stage 6, Lower Secondary, stage 7, Lower Secondary, stage 8, Lower Secondary, stage 9, IGCSE
Netherlands: Groep 6, Groep 7, Groep 8, Year 2, Year 3 (havo, vwo), Havo · Mathematics A, Vwo · Mathematics A, Vwo · Mathematics C, Groep 5, Vmbo bb (years 3-4), Vmbo kb (years 3-4), Vmbo gt (years 3-4)
Türkiye (MEB): Year 5 (MEB), Year 6 (MEB), Year 7 (MEB), Year 8 (MEB), Year 9 (MEB), Year 10 (MEB), Year 12 (MEB)
England (GCSE, A Level): Year 4, Year 5, Year 6, Year 7, Year 8, Year 9, Year 10 (GCSE), Year 11 (GCSE), Year 12 (A Level), Year 13 (A Level)
USA (Common Core): Grade 5, Grade 6, Grade 3, Grade 4, Grade 7, Grade 8, Algebra 1, Algebra 2
What the applications of this topic teach 11 applications
Statistical questions: ask, plan, collect
- Telling a statistical question from a question about one person
- Saying which data answer a question: variable, group, kind
- Choosing how to collect data: survey, counting, measuring, experiment
- Setting up an empty data collection sheet
Tally marks and frequency tables
- Making tally marks in fives and counting a tally
- Sorting answers into a frequency table
- Reading a table: most, fewest, altogether, how many more
- Writing the share of a category as a percentage
Kinds of data: categorical, discrete, continuous
- Telling categorical data from numerical data
- Knowing that numbers used as names are categorical
- Telling discrete data from continuous data and rounding measured values
Group data into classes
- Grouping numerical data into classes of equal width
- Writing classes as 10 ≤ x < 20 or 10–19
- Choosing a class width and start for about 5 to 8 classes
- Knowing classes leave no gaps and do not overlap
Who do we ask? Samples and bias
- Telling a population from a sample
- Telling a fair sample from a biased one
- Estimating a count for the population from a random sample
- Spotting a leading question and writing a neutral one
Data in everyday life
- Seeing ways to collect data in everyday scenes
- Telling primary from secondary data
- Reading a table with rows and columns, with totals and differences
- Working out the share of a category in a poll
Table detective
- Using the total to find a missing frequency
- Using clues to find missing numbers in a table
Response rates, who answers and confirmation bias
- Working out a response rate and what a low rate may do
- Seeing how groups answering at different rates bias the result
- Explaining confirmation bias
Two categories: from question to table
- Turning a situation into a question about two categorical variables
- Planning a survey: who is asked, how many, random or not
- Counting survey answers into a two-way table
Investigate one variable
- Choosing the kind of question and the fitting display and summary
- Analysing two groups by display, centre and spread
- Judging whether the data support a statement: in this sample
Ready-made data lab
- Picking a ready-made data set and two variables
- Choosing a display and a summary that fit the kind of question
- Judging statements as supported or not supported